Idea Derivation Bar Chart Template – Market and Competitor Analysis
RJ0200002_7
- Last Update 03/29/2025
- File Size 0.4MB
- # of Slides 2
- File Format PPTX
- Slide Ratio 16:9
- Color
Keywords
- #Content-Based Slides
- #Design-Based Slides
- #Market and Competitor Analysis
- #Marketing Plan and Strategy
- #Graph
- #Market Status
- #Marketing Objectives
- #Column
- #Column Chart
- #16:9
- #horizontal bar chart PowerPoint
- #bar graph presentation slide
- #data comparison chart
- #market analysis PowerPoint
- #competitor analysis slide
- #6-item comparison template
About the Product
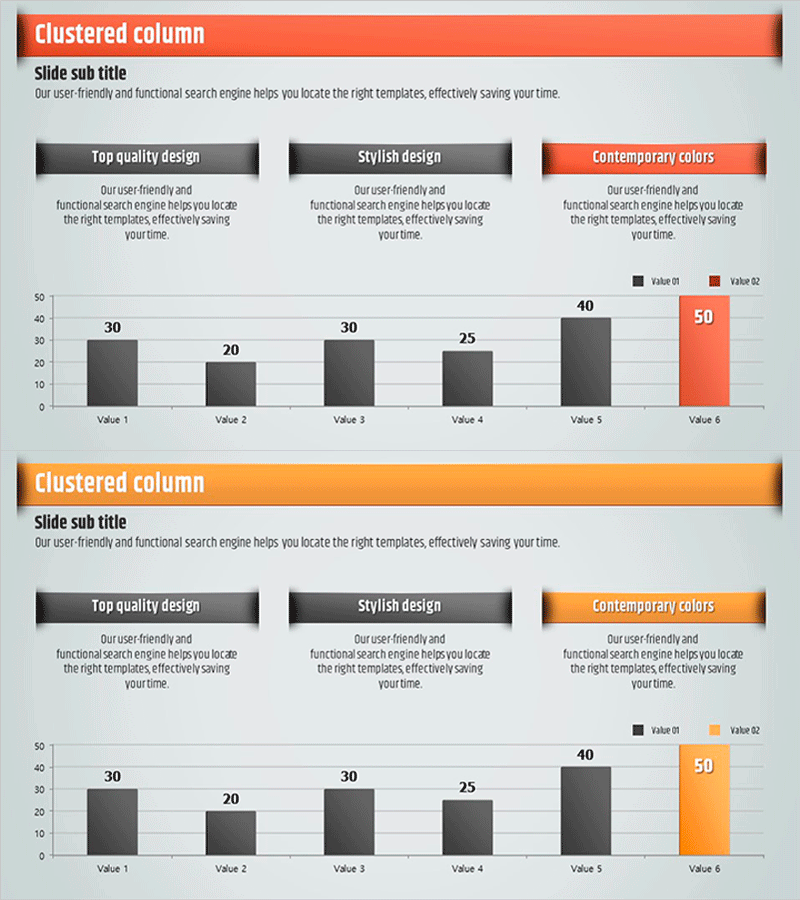
A horizontal bar chart PowerPoint slide designed to clearly present market and competitor analysis data essential for marketing strategy development. This slide structure compares six items across two data series (gray and orange) to effectively visualize performance metrics and competitive positioning. The chart features three tab-style category options (Top quality design, Stylish design, Contemporary colors) at the top, allowing you to emphasize different analytical perspectives. The intuitive data visualization accelerates decision-making processes. Formatted in 16:9 widescreen with 2 slides, all chart elements are fully editable, enabling instant customization to match your actual data without design expertise.
Usage Points
-
Main Usage
Ideal for marketing plans, business proposals, and quarterly performance reports where you need to compare market size, competitor strengths, and your company's competitive advantages using numerical data. The parallel comparison of six items reveals relative positioning and gaps at a glance, providing clear evidence for strategic decisions.
-
How to Use
Double-click the chart area to enter your data; bar lengths adjust automatically. Replace tab category names and legend labels (Value 01, Value 02) with your actual analysis items, update the numerical values, and the chart is complete. Color modifications can be applied easily through the chart formatting options.
-
Recommended For
Recommended for marketing managers, strategy planning teams, and executive presentations. Particularly effective when presenting quantitative research findings, competitive benchmarking results, product performance comparisons, or customer satisfaction survey data that requires persuasive numerical visualization.
-
Slide Structure
Two-slide set with consistent layout. Each slide contains a header section (title and subtitle), three tab-style category selection areas, a central horizontal bar chart comparing six items across two data series, and a legend at the bottom. First slide uses gray and orange color scheme; second slide provides a color variation for design flexibility.
Related Products
-

Simple & Modern Wide PowerPoint Vertical Bar Chart
#Market and Competitor Analysis #Financial Plans and Performance #Graph
-

Orange Green Highlight Bar Chart – Market Analysis and Marketing Strategy
#Market and Competitor Analysis #Marketing Plan and Strategy #Graph
-

Fantastic Wide PowerPoint Map & Bar Chart
#Company Introduction #Market and Competitor Analysis #Graph
-

Graph Visualizing Trends in Hobby Demand – Market Analysis Template
#Market and Competitor Analysis #Graph #Market Status
