Space Industry Analysis Smooth Line Graph
RJ0700003_12
- Last Update 07/21/2025
- File Size 0.4MB
- # of Slides 2
- File Format PPTX
- Slide Ratio 16:9
- Color
Keywords
- #Content-Based Slides
- #Design-Based Slides
- #Market and Competitor Analysis
- #Marketing Plan and Strategy
- #Diagram
- #Graph
- #Market Analysis
- #Target Market Strategy
- #Cluster
- #Line
- #Closed Cluster Diagram
- #Line Chart
- #16:9
- #line chart PowerPoint slide
- #market analysis presentation template
- #space industry slide deck
- #data visualization PPT
- #trend analysis slide
- #3-series graph template download
About the Product
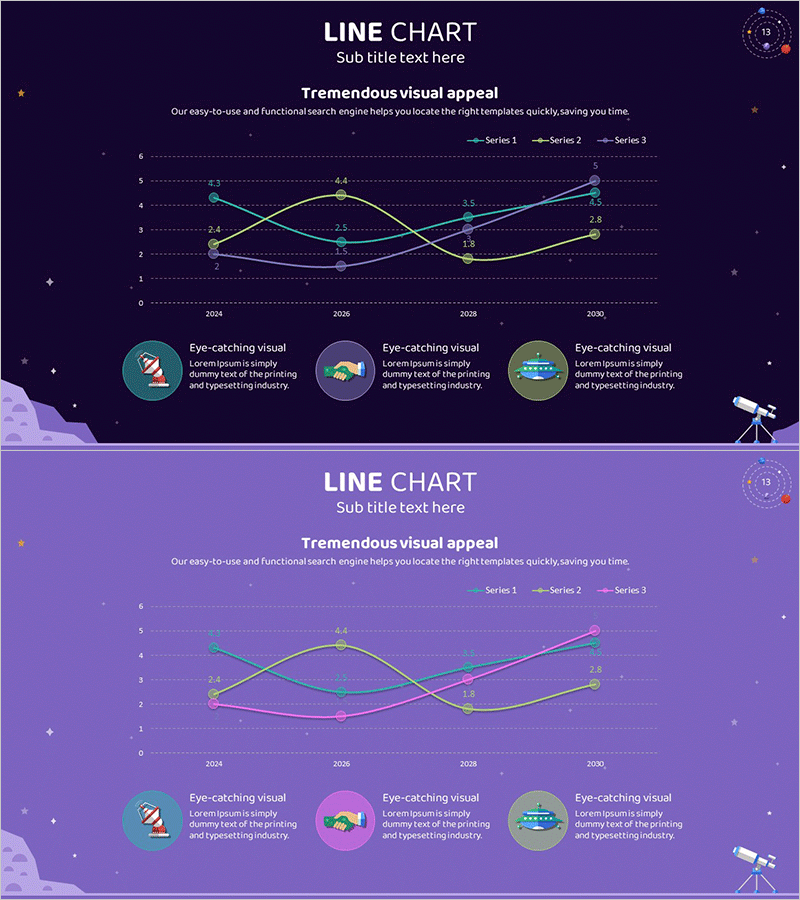
A 3-series line chart PowerPoint slide designed for space industry market analysis presentations. Set against a dark purple background, three colored curves in cyan, yellow, and green intersect to visualize data trends from 2024 to 2030. Each data point displays numerical labels for precise value comparison, while three icon sections at the bottom highlight key insights. Available in 16:9 PPTX format, fully editable and ready for marketing strategy, competitive analysis, and market trend presentations.
Usage Points
-
Main Usage
Ideal for comparing year-over-year growth trends across three metrics in space, aerospace, and emerging technology sectors. Simultaneously display competitor performance, market size, and technology adoption rates to provide comprehensive market insights.
-
How to Use
Double-click each curve and data point to modify values, then update the legend labels (Series 1, 2, 3) to match your actual metrics. Replace the three icon section texts with key findings to customize the slide for your presentation context.
-
Recommended For
Strategic planning, marketing, and business development teams presenting market analysis. Ideal for investor pitch decks, new business planning reports, and industry trend seminars. Particularly effective for executive briefings and external presentations requiring multi-variable comparisons.
-
Slide Structure
Two-slide set featuring identical 3-series line charts on dark purple and light purple backgrounds respectively. Each slide displays six data points spanning 2024–2030, with three circular icon areas at the bottom for supplementary text and insights.
Related Products
-

Chemical Experiment Analysis Broken Line Graph – Insights and Data Visualization
#Market and Competitor Analysis #Diagram #Graph
-

Competitor Analysis Broken Line Graph – Visualizing Market Trends
#Market and Competitor Analysis #Diagram #Graph
-

Line Charts for Living Conditions – Visualizing Market Analysis
#Market and Competitor Analysis #Diagram #Graph
-

Competitor Market Analysis Broken Line Graph – Enhance Business Strategy with Data Visualization
#Market and Competitor Analysis #Diagram #Graph
