Competitor Analysis Broken Line Graph – Visualizing Market Trends
RJ0300042_26
- Last Update 04/29/2025
- File Size 0.3MB
- # of Slides 2
- File Format PPTX
- Slide Ratio 16:9
- Color
Keywords
- #Content-Based Slides
- #Design-Based Slides
- #Market and Competitor Analysis
- #Diagram
- #Graph
- #Competitor Analysis
- #Market Analysis
- #Cluster
- #Line
- #Closed Cluster Diagram
- #Line Chart
- #16:9
- #line chart PowerPoint
- #3-series line graph
- #market trend analysis presentation
- #competitor analysis slide
- #trend visualization template
About the Product
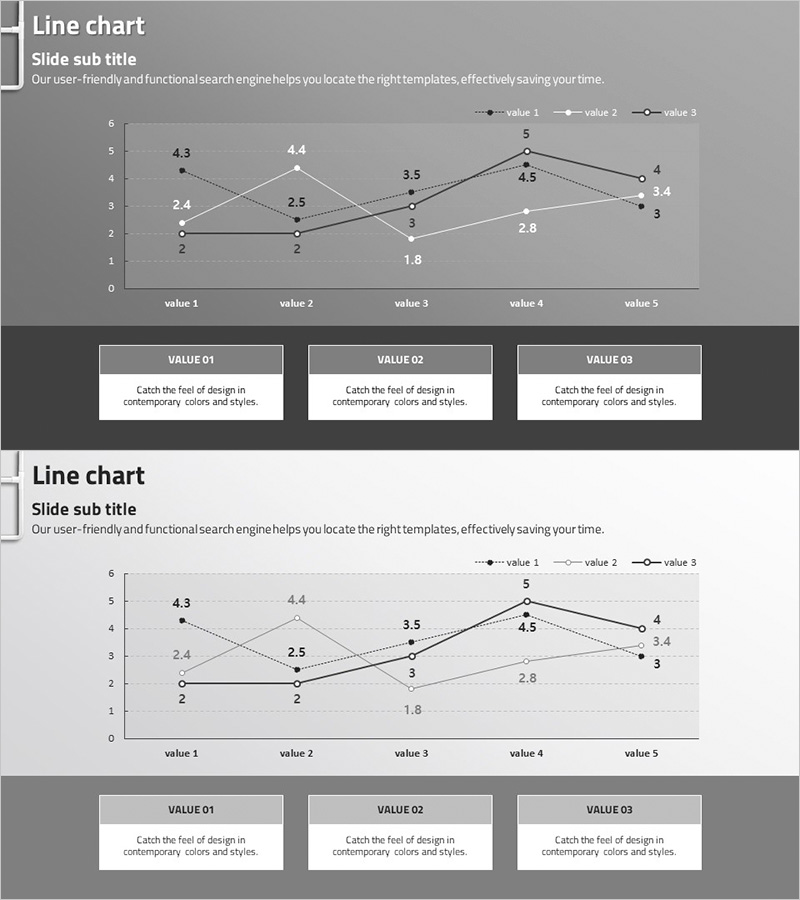
A 3-series line chart PowerPoint slide designed to visualize competitor analysis and market trends across five time points. This presentation template displays three data series simultaneously, with each data point clearly labeled with numerical values for precise information delivery. Two layout versions are included: a dark gray background design with white lines for high contrast, and a clean light background version. Below the chart, three text box areas (VALUE 01–03) allow you to add detailed insights for each series. Provided in 16:9 widescreen PPTX format, fully editable and ready to customize with your own data.
Usage Points
-
Main Usage
Optimized for comparing multiple data series over time, enabling simultaneous analysis of trends. Ideal for presenting competitor performance metrics, market share evolution, sales progression, customer satisfaction trends, and other multi-series datasets in a single, comprehensive view.
-
How to Use
Adjust the Y-axis range (0–6) and X-axis points (value 1–5) to match your data, then input the values for each series. The lines update automatically. Complete your presentation narrative by adding key insights and series descriptions in the text boxes below the chart.
-
Recommended For
Executive reports, business analysis presentations, marketing strategy meetings, investor pitches, and quarterly performance reviews. Particularly effective for competitive landscape analysis, market trend explanations, and comparative performance assessments requiring data-driven decision support.
-
Slide Structure
Title area at top, central line chart (3 series × 5 points, range 0–6, with data labels), and three text box areas below (one per series for descriptions). Two color background versions provided: dark gray and white.
Related Products
-

Competitor Market Analysis Broken Line Graph – Enhance Business Strategy with Data Visualization
#Market and Competitor Analysis #Diagram #Graph
-

Interior Market Analysis Graph – Insights into Market Status
#Market and Competitor Analysis #Diagram #Graph
-

Competitor Market Analysis Table – Strategic Insights
#Market and Competitor Analysis #Diagram #Graph
-

Line Graph and Clustered Column Graph – Essential for Competitor Analysis
#Market and Competitor Analysis #Graph #Competitor Analysis
