Line Charts for Living Conditions – Visualizing Market Analysis
RJ0900028_36
- Last Update 08/24/2025
- File Size 0.3MB
- # of Slides 2
- File Format PPTX
- Slide Ratio 16:9
- Color
Keywords
About the Product
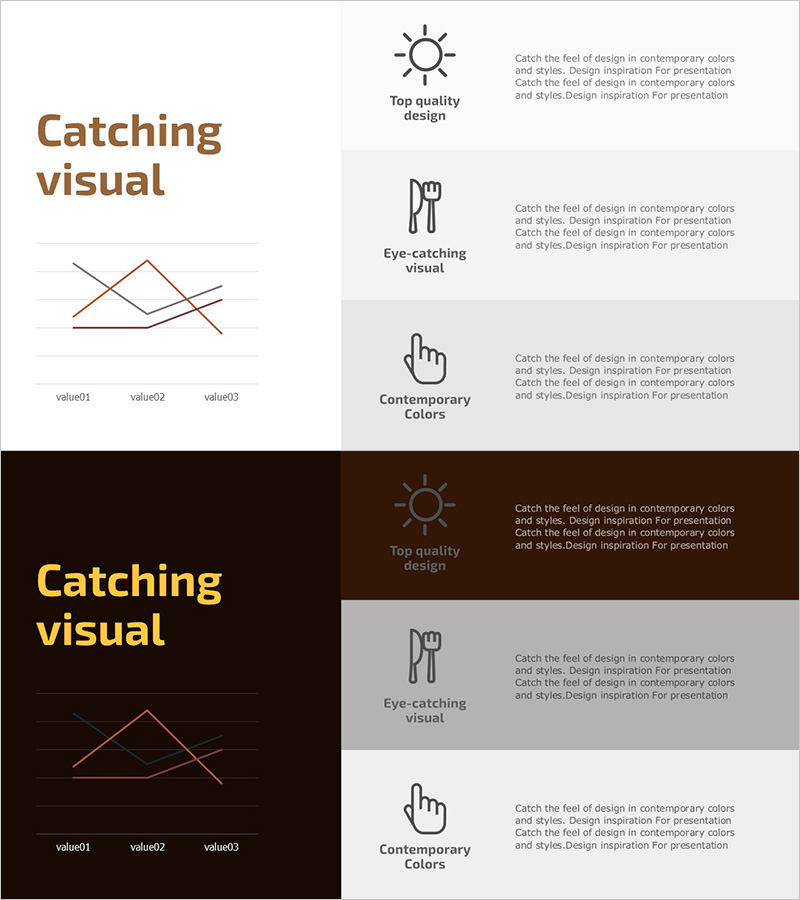
A line chart PowerPoint slide designed to visualize living conditions indicators and market analysis data. The slide features three distinct data series displayed on a minimalist background in beige and brown tones, with each line differentiated by color for easy comparison. The chart includes value01, value02, and value03 labels to clearly show trends over time. This presentation template is ready to use in business reports, market research presentations, financial analysis documents, and strategic planning decks.
Usage Points
-
Main Usage
Ideal for comparing multiple data series trends over time. Effectively displays market indicators, sales trends, customer satisfaction changes, and other multi-variable metrics simultaneously. The intersection points and upward/downward segments of each line are instantly recognizable.
-
How to Use
Place this slide in the analysis section of reports or financial performance presentations. Simply input your data into the value01, value02, and value03 positions. Line colors and background tones are fully editable to match your company's brand guidelines. Two slide versions—light and dark backgrounds—are provided for flexible use.
-
Recommended For
Recommended for executive briefings, market analysts, finance teams, consulting firms, and academic presentations. Particularly effective for quarterly/annual performance comparisons, competitive benchmarking, customer behavior analysis, and any scenario requiring multi-variable trend visualization.
-
Slide Structure
Two-slide set with 3-series line charts on each. The first slide features a light background (beige/white) with brown text; the second uses a dark background (dark brown) with gold text for flexible presentation contexts. Each data point is marked with clear nodes for precise data reading and professional appearance.
Related Products
-

Chemical Experiment Analysis Broken Line Graph – Insights and Data Visualization
#Market and Competitor Analysis #Diagram #Graph
-

Graph of Industrial Change and Global Market Analysis – Understanding Market Trends
#Market and Competitor Analysis #Diagram #Graph
-

Interior Market Analysis Graph – Insights into Market Status
#Market and Competitor Analysis #Diagram #Graph
-

Competitor Market Analysis Broken Line Graph – Enhance Business Strategy with Data Visualization
#Market and Competitor Analysis #Diagram #Graph
