Analysis of Annual Health Checkup Data – Market and Marketing Strategies
RJ0700016_20
- Last Update 07/26/2025
- File Size 0.4MB
- # of Slides 2
- File Format PPTX
- Slide Ratio 16:9
- Color
Keywords
- #Content-Based Slides
- #Design-Based Slides
- #Market and Competitor Analysis
- #Marketing Plan and Strategy
- #Graph
- #Competitor Analysis
- #Marketing Strategy
- #Column
- #Segmented Column
- #16:9
- #stacked bar chart PowerPoint
- #vertical bar graph slide
- #data analysis presentation
- #year-over-year comparison chart
- #health checkup data visualization
- #how to create stacked bar chart in PowerPoint
About the Product
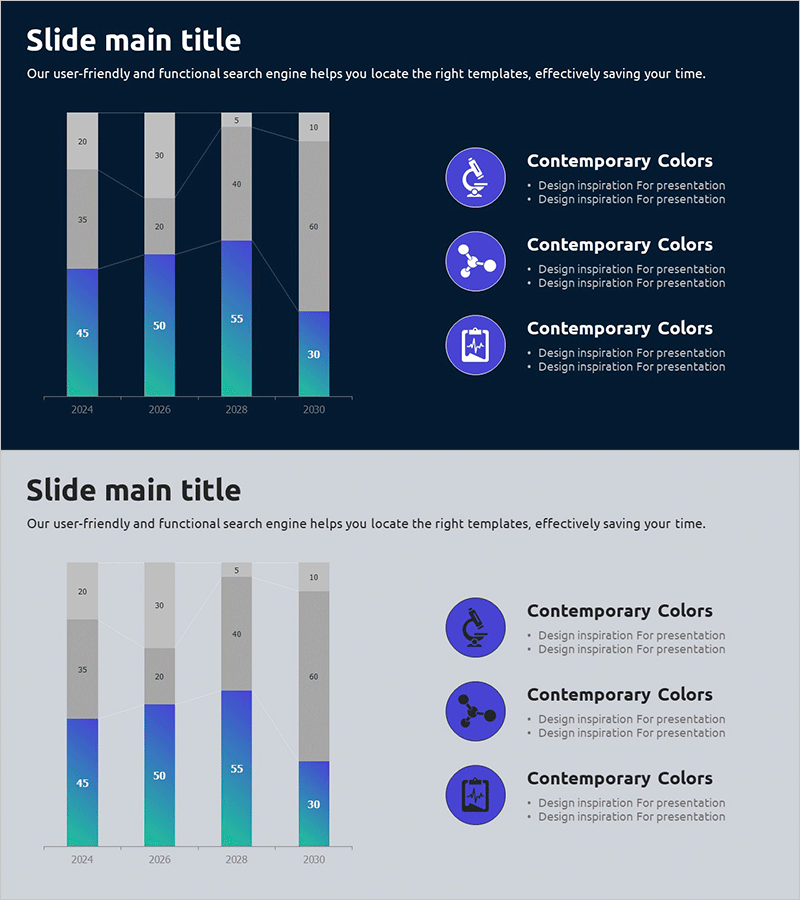
A stacked vertical bar chart PowerPoint slide designed to visualize annual health checkup data across multiple years. This presentation template displays data from 2024 to 2030 using three distinct color series: gray, blue, and teal, with numerical labels clearly positioned above each bar segment. The dark navy background combined with bright white typography ensures excellent readability during presentations. The right side features three explanation areas for highlighting key insights and findings. This slide deck is ready to use for marketing strategies, market analysis reports, healthcare data presentations, and business performance reviews.
Usage Points
-
Main Usage
This slide enables clear visualization of health checkup data trends and item-by-item comparisons across multiple years. The stacked bar structure allows simultaneous comparison of multiple data series, effectively communicating year-over-year changes and patterns. Ideal for marketing strategy presentations, market analysis reports, healthcare data discussions, and business performance briefings.
-
How to Use
Double-click the bar chart to edit with your own data. Simply input years, item names, and numerical values, and the chart automatically updates. Add key insights or conclusions in the right-side explanation areas to strengthen data interpretation. Adjust color schemes using PowerPoint's theme color options to match your brand guidelines.
-
Recommended For
Recommended for healthcare and wellness industry data analysts, marketing professionals, and executives preparing performance reports. Suitable for year-over-year performance comparisons, market trend analysis, business outcome reports, academic presentations, consulting deliverables, and investor pitch decks. Works well for any presentation requiring quantitative multi-series data visualization.
-
Slide Structure
2-slide template. Each slide features a stacked vertical bar chart (4 years × 3 data series = 12 bar segments) paired with a right-side explanation area containing 3 text boxes. Design includes dark navy background, gray-blue-teal gradient bars, white numerical labels, and purple circular icons for visual emphasis.
Related Products
-

Space Industry Analysis Bar Graph – Market and Competitive Analysis
#Market and Competitor Analysis #Marketing Plan and Strategy #Graph
-

Comparison Chart of Pet Expenditure – Essential Template for Competitor Analysis
#Market and Competitor Analysis #Diagram #Graph
-

Market Analysis Segmented Bar Graph & Table Chart – Visualization of Competitive Analysis
#Market and Competitor Analysis #Diagram #Graph
-

Business Analysis Segmented Vertical Bar Graph – Optimized for Market and Competitor Analysis
#Market and Competitor Analysis #Graph #Competitor Analysis
