Blue Red Analysis Chart – New Insights into Market Analysis
RJ0300053_5
- Last Update 05/02/2025
- File Size 1.4MB
- # of Slides 2
- File Format PPTX
- Slide Ratio 16:9
- Color
Keywords
- #Content-Based Slides
- #Design-Based Slides
- #Market and Competitor Analysis
- #Diagram
- #Graph
- #Future Outlook
- #Market Analysis
- #Table
- #Column
- #Standard Table
- #Column Chart
- #16:9
- #horizontal bar chart PowerPoint
- #dual-series chart template
- #market analysis slide
- #comparison graph PowerPoint
- #data visualization slide template
About the Product
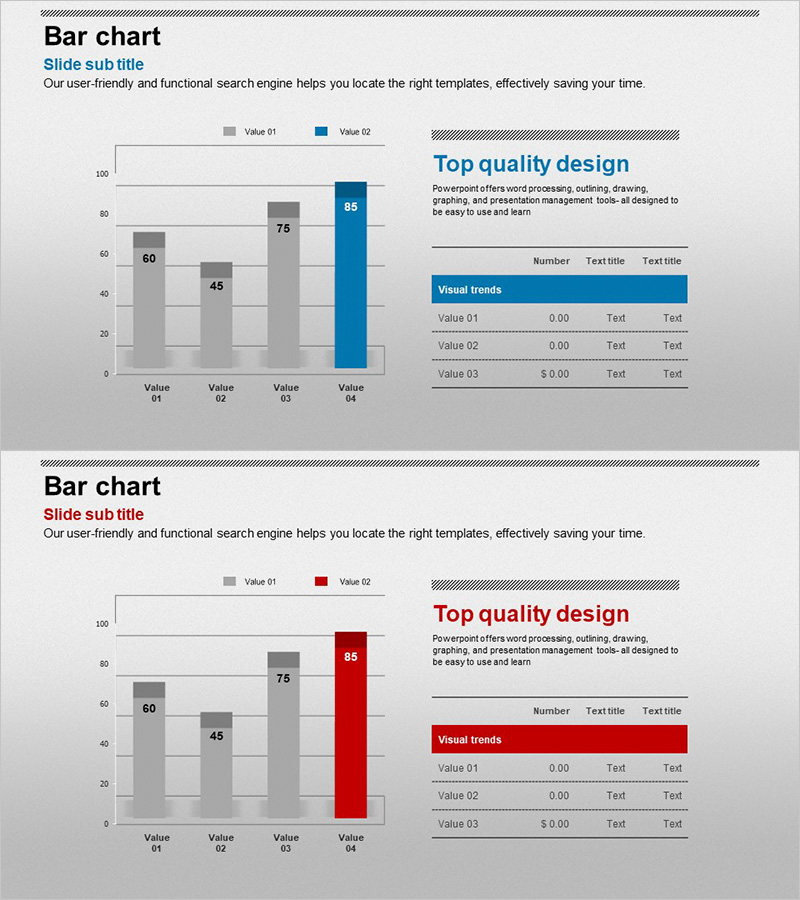
A dual-series horizontal bar chart PowerPoint slide optimized for market analysis and competitive comparison. This presentation template uses contrasting blue and red colors to clearly distinguish between two data sets across four items, making numerical comparisons immediate and intuitive. The right side features a dedicated text area for key insights and a data table for detailed figures, enabling seamless integration into professional presentations. Delivered as 2 slides in 16:9 widescreen format with fully editable colors, values, and labels.
Usage Points
-
Main Usage
Compare two data series side-by-side to visualize market share, competitor performance, year-over-year trends, or departmental metrics. The contrasting blue and red bars create immediate visual differentiation, while the accompanying text box and data table provide space for detailed analysis and strategic insights.
-
How to Use
Replace bar lengths and values with your actual data. Update axis labels, legend text, and item names to match your presentation topic. Fill the 'Key Insights' section on the right with findings and recommendations, and populate the data table with precise figures to strengthen credibility and audience engagement.
-
Recommended For
Marketing professionals, executives, management consultants, and sales teams presenting market reports, competitive analysis, quarterly performance reviews, and strategic proposals. Ideal for investor presentations, board meetings, and client pitches where data-driven persuasion is essential.
-
Slide Structure
Slide 1: Title + 4-item horizontal bar chart with dual series (Value 01–04, each with 2 data series in blue and red). Slide 2: Identical chart + right-side 'Key Insights' text box + 3-row data table (Item, Value, Description). 16:9 aspect ratio, grid background, legend included.
Related Products
-

Comparison Graph of Future Outlook - Essential Tool for Market Analysis
#Market and Competitor Analysis #Graph #Future Outlook
-

Business Meeting Analysis Bar Graph Slide – Market and Competitive Analysis
#Market and Competitor Analysis #Graph #Future Outlook
-

Business Future Outlook Analysis Diagram - Market Analysis and Competitive Advantage
#Market and Competitor Analysis #Graph #Future Outlook
-

Future Outlook Analysis Bar Graph – Essential for Market Analysis
#Market and Competitor Analysis #Graph #Future Outlook
