Cement Theme Bar Graph & Table
RJ0300058_22
- Last Update 05/03/2025
- File Size 3MB
- # of Slides 2
- File Format PPTX
- Slide Ratio 16:9
- Color
Keywords
- #Content-Based Slides
- #Design-Based Slides
- #Market and Competitor Analysis
- #Diagram
- #Graph
- #Competitor Analysis
- #Market Analysis
- #Table
- #Horizontal Bar
- #Standard Table
- #Horizontal Bar Chart
- #16:9
- #horizontal bar chart PowerPoint
- #bar graph slide template
- #data comparison presentation
- #market analysis slide
- #competitive analysis PowerPoint
About the Product
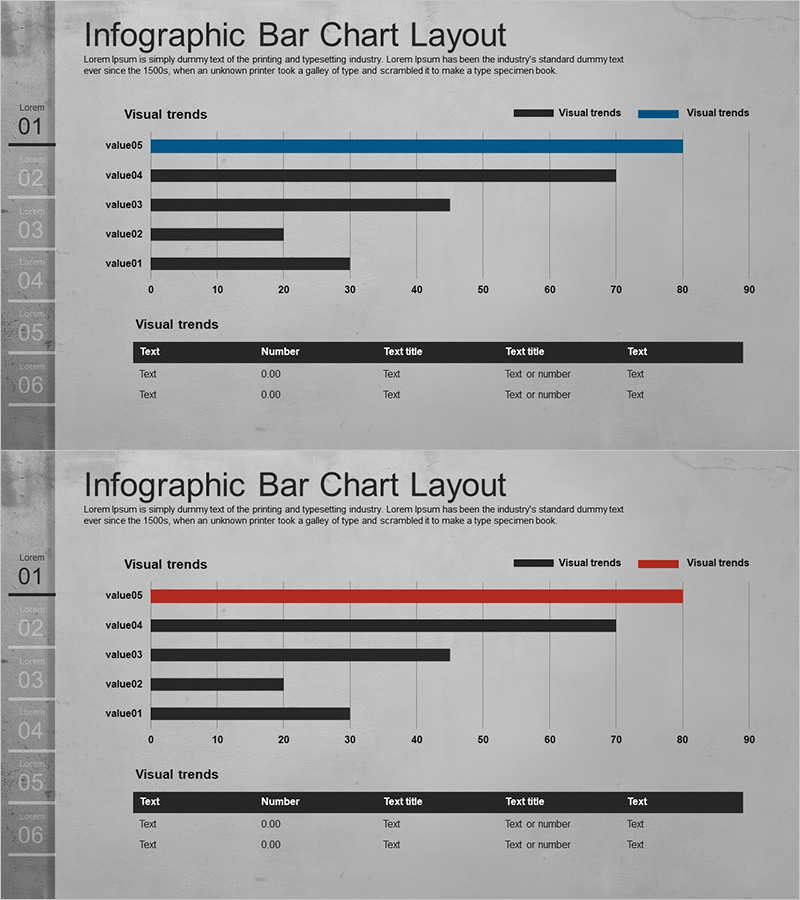
A horizontal bar chart PowerPoint slide featuring five data items displayed with black and blue bars against a cement-gray background. The chart uses a 0–90 scale to represent comparative values, with a legend distinguishing two data series. Below the chart, a five-column information table provides detailed metrics and text descriptions. This slide design is ideal for market analysis, competitive benchmarking, performance metrics, and data-driven business presentations that require both visual comparison and detailed reference information.
Usage Points
-
Main Usage
Visualize comparative numerical data using horizontal bars while providing supplementary details in a structured table format. The bar length communicates relative magnitude intuitively, while the legend and table deliver precise values and contextual information simultaneously.
-
How to Use
Apply to market research findings, competitor performance benchmarking, quarterly revenue reports, customer satisfaction surveys, or product feature comparisons. Edit the bar colors and table data with your own information for immediate deployment in presentations.
-
Recommended For
Marketing professionals, sales managers, business executives, management consultants, and data analysts who need to communicate quantitative insights. Particularly suited for competitive analysis, market assessment, and performance evaluation presentations.
-
Slide Structure
Title area at top, horizontal bar chart in center (5 items, 2 data series, 0–90 scale), information table at bottom (5 columns: Text·Number·Text title·Text title·Text). Cement-gray background with black and blue bars and black table header create clear information hierarchy.
Related Products
-

Blue Green Horizontal Bar Graph – Optimized for Market and Competitive Analysis
#Market and Competitor Analysis #Diagram #Graph
-

Sugar Content Analysis Bar Graph Table
#Market and Competitor Analysis #Diagram #Graph
-

Stylish Bar Chart Slide Design
#Market and Competitor Analysis #Diagram #Graph
-

Competitor and Customer Analysis Horizontal Bar Graph and Table
#Market and Competitor Analysis #Diagram #Graph
