Type Comparison Analysis Graph & Table – Effective Tool for Market Analysis
RJ0300062_13
- Last Update 05/05/2025
- File Size 0.3MB
- # of Slides 2
- File Format PPTX
- Slide Ratio 16:9
- Color
Keywords
- #Content-Based Slides
- #Design-Based Slides
- #Market and Competitor Analysis
- #Diagram
- #Graph
- #Market Analysis
- #Competitive Advantage
- #Table
- #Circles
- #Standard Table
- #Doughnut Chart
- #16:9
- #donut chart PowerPoint
- #pie chart slide template
- #ratio analysis graph
- #market analysis PPT
- #competitive comparison chart
- #data visualization presentation
About the Product
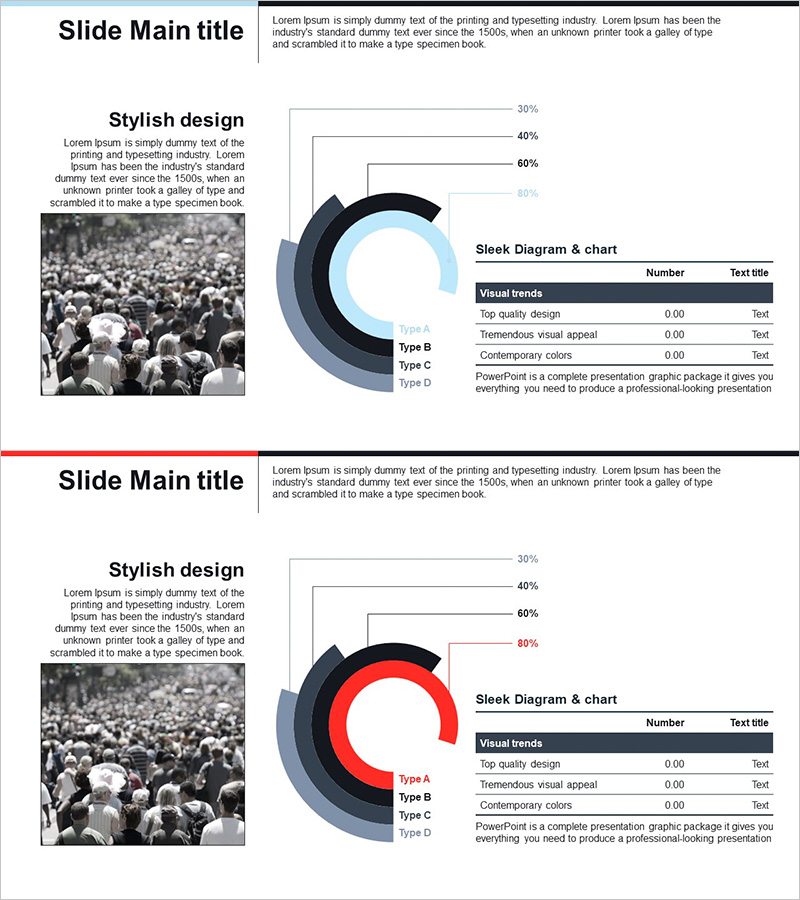
A donut chart PowerPoint slide optimized for market analysis and competitive comparison. The three-layer structure in dark blue, light blue, and charcoal tones intuitively expresses the ratio of four items, while the right-side table presents numerical data precisely. The 2-slide set includes a variant version with red accent for comparative analysis scenarios. In 16:9 widescreen PPTX format, it is ready for immediate editing and enhances data credibility in the market overview section of executive reports, strategy presentations, and marketing plans.
Usage Points
-
Main Usage
The donut chart clearly expresses the proportional relationship of each item relative to the whole, while the right-side table simultaneously presents numerical data to enhance quantitative credibility. It is used for analyzing composition data such as market share, customer composition, and product category revenue distribution.
-
How to Use
Use in the market overview section of executive reports or the competitive analysis part of strategy presentations. Slide 1 serves as the base version (blue tone) and Slide 2 as the emphasis version (red tone) to structure comparative scenarios. Edit text and figures directly to reflect actual data.
-
Recommended For
Ideal for executives, business development teams, marketing teams, and finance teams presenting market analysis results. Particularly suited for explaining competitor market share comparison, customer segment composition, and product line revenue structure in pitch decks, business plans, and quarterly management reports.
-
Slide Structure
Each slide consists of a left text area (title and description) and a right donut chart with data table. The donut is divided into 4 segments (Type A, B, C, D), each distinguished by different shades of blue. The right table provides 3 rows (Visual trends, Top quality design, Tremendous visual appeal, Contemporary colors) with input fields for numbers and text.
Related Products
-

Key Competitive Factors in Market Analysis – First Step Toward Competitive Advantage
#Market and Competitor Analysis #Diagram #Graph
-

Drug Addiction Risk Analysis Graph Chart – Insightful Information Delivery
#Market and Competitor Analysis #Diagram #Graph
-

Shareholder Status Analysis Donut Pie Chart – Corporate Growth and Competitive Analysis
#Company Introduction #Market and Competitor Analysis #Diagram
-

Development Status Analysis Chart - Visualization for Effective Market Analysis
#Product/Service Introduction #Market and Competitor Analysis #Diagram
