Business Note Analysis Circle Graph & Table – Market and Competitive Analysis
RJ0300045_10
- Last Update 04/30/2025
- File Size 0.2MB
- # of Slides 2
- File Format PPTX
- Slide Ratio 16:9
- Color
Keywords
- #Content-Based Slides
- #Design-Based Slides
- #Market and Competitor Analysis
- #Diagram
- #Graph
- #Market Analysis
- #Competitive Advantage
- #Table
- #Circles
- #Standard Table
- #Pie Chart
- #16:9
- #pie chart PowerPoint slide
- #circular graph template
- #market analysis table
- #competitive analysis chart
- #data visualization slide
- #business analytics PPT
- #how to create pie chart in PowerPoint
About the Product
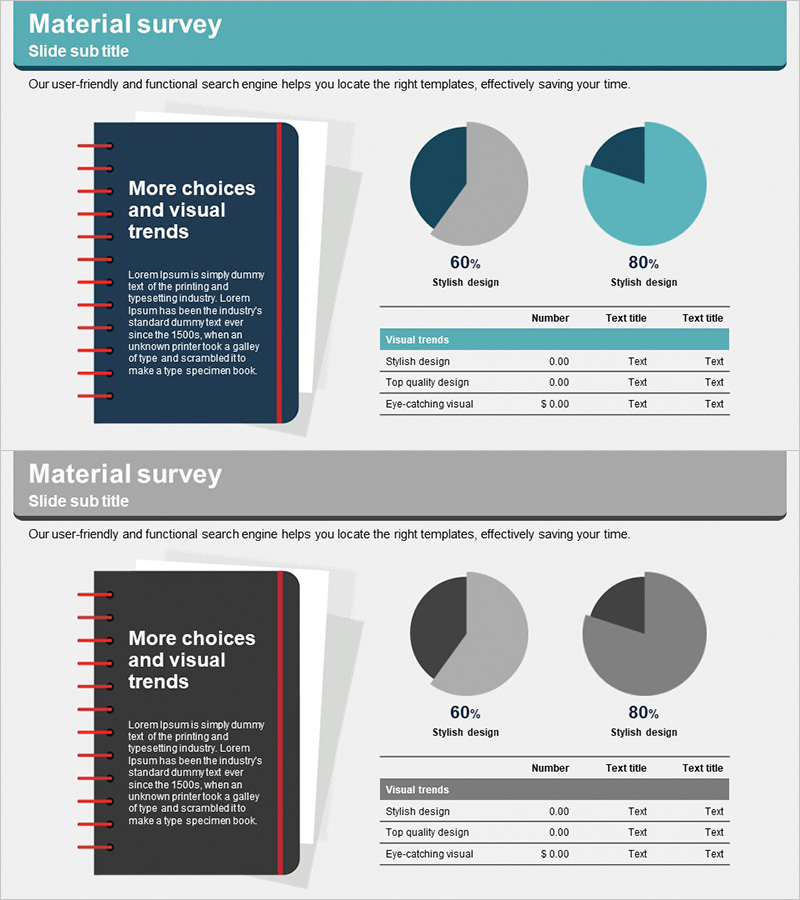
A professional PowerPoint slide optimized for market analysis and competitive comparison. The left side features a two-segment pie chart visualizing proportion data, while the right side includes a structured table for detailed metrics. The dark blue and turquoise color scheme emphasizes credibility and analytical rigor. Designed for data-driven presentations, this 2-slide deck uses 16:9 widescreen format compatible with modern presentation environments. All elements are fully editable in PPTX format, allowing customization of data values, labels, and color schemes to match your brand guidelines.
Usage Points
-
Main Usage
Visualize market size, share, and competitor metrics using pie charts while organizing detailed indicators in accompanying tables. Ideal for business plans, marketing proposals, investor presentations, and executive reports requiring quantitative data representation.
-
How to Use
Input proportion data into the left pie chart segments and populate the right table with metric names, values, and descriptions. Colors are fully customizable to match corporate branding. Duplicate slides to present multiple analysis categories or comparison sets.
-
Recommended For
Strategy planning teams, marketing departments, and executive leadership preparing data-driven presentations. Suitable for market research, competitive benchmarking, business performance analysis, customer segmentation, and strategic planning documents.
-
Slide Structure
Slide 1: Header + left two-segment pie chart (60% and 80% proportions) + right three-row table (metric name, value, description columns). Slide 2: identical layout for alternative analysis topics. Dark blue background with turquoise accent elements and white typography.
Related Products
-

Market Analysis Report Visualized with Pie Chart
#Market and Competitor Analysis #Diagram #Graph
-

Graph Charts for Systematic Market Analysis – Bar and Pie Charts
#Technical Approach #Market and Competitor Analysis #Diagram
-

Drug Addiction Risk Analysis Graph Chart – Insightful Information Delivery
#Market and Competitor Analysis #Diagram #Graph
-

Brown Blue Detailed Analysis Chart - Market and Competitor Analysis
#Market and Competitor Analysis #Diagram #Graph
