Adventure Business Strategy Cycle Diagram
RJ0600055_13
- Last Update 07/05/2025
- File Size 5.7MB
- # of Slides 2
- File Format PPTX
- Slide Ratio 16:9
- Color
Keywords
About the Product
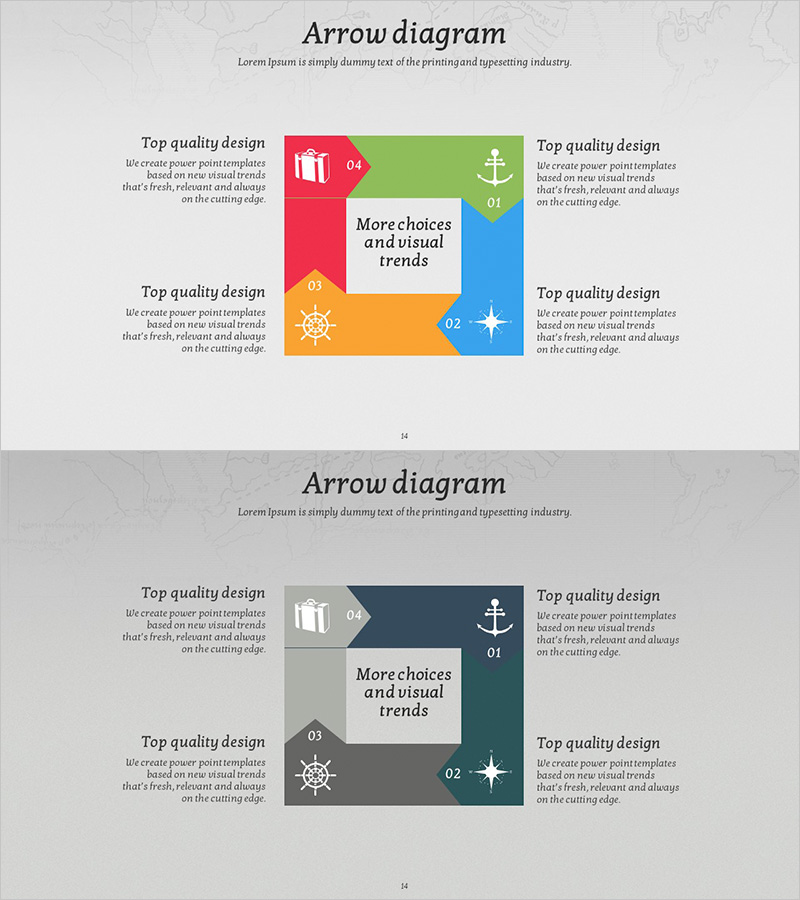
A PowerPoint slide that visualizes business strategy in a 4-stage circular flow structure. Arrows converge from four directions (top, bottom, left, right) toward a central core message, clearly expressing strategic cycles, business processes, and circular workflows. Four distinct colors—red, orange, green, and blue—differentiate each stage, while icons and numbered labels emphasize sequence and progression. This 2-slide set is ready to use in presentations, planning documents, and reports where strategy flowcharts, business vision, and data visualization are needed.
Usage Points
-
Main Usage
Visualizes business strategy, process cycles, and circular workflows in a 4-stage structure to communicate strategic continuity and cyclical organization to your audience. The convergence of four directions toward a central message promotes integrated thinking and holistic understanding.
-
How to Use
Use in business plans, strategy presentations, and management reports within vision and strategy sections to explain cyclical processes. Insert text, data, and images into each stage, and use color coding and icons to emphasize stage-by-stage differences and progression.
-
Recommended For
Recommended for executives, strategy teams, marketing departments, and project managers explaining business direction, circular processes, and sustainable strategies. Effective in investor pitch decks, executive meetings, strategy workshops, and training seminars for expressing complex flows simply and clearly.
-
Slide Structure
Central text box containing the core message with arrows converging from four directions. Each direction features a color-coded rectangle (red, orange, green, blue) with numbered labels (01–04), icons, and text areas representing the 4-stage circular structure. Provided in two color variations: full color and monochrome.
Related Products
-

Three Key Strategies – Visualizing Business Vision and Strategy
#Business Vision and Strategy #Diagram #Business Vision
-

Keyword Connection Diagram – Visualizing Business Vision and Strategy
#Business Vision and Strategy #Diagram #Business Vision
-

Business Strategy Structure Diagram – Setting Effective Marketing Strategy Goals
#Business Vision and Strategy #Marketing Plan and Strategy #Diagram
-

Game Product Service Differentiation Strategy Slide – Utilizing Circular Diagram
#Product/Service Introduction #Business Vision and Strategy #Diagram
