Pill Market Analysis Vertical Bar Graph – Clear Visualization of Market Status
RJ0400018_9
- Last Update 05/22/2025
- File Size 0.5MB
- # of Slides 2
- File Format PPTX
- Slide Ratio 16:9
- Color
Keywords
- #Content-Based Slides
- #Design-Based Slides
- #Market and Competitor Analysis
- #Graph
- #Competitor Analysis
- #Market Analysis
- #Column
- #Grouped Column
- #16:9
- #grouped vertical bar chart PowerPoint
- #positive negative data visualization slides
- #multi-series bar graph template
- #market analysis presentation
- #data comparison PowerPoint download
About the Product
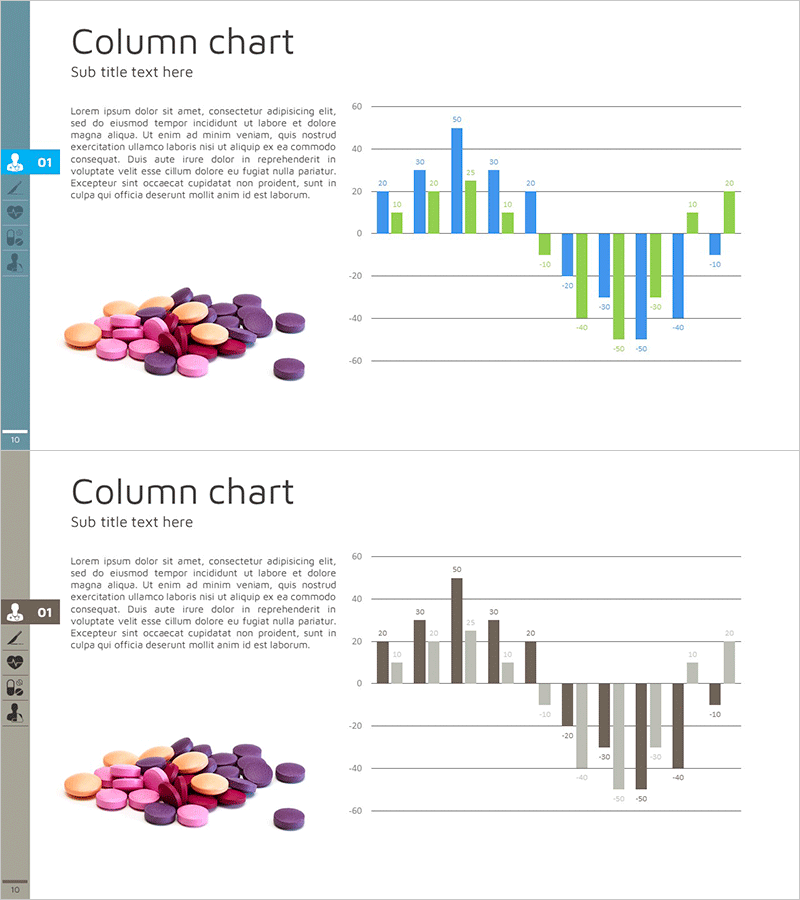
A grouped vertical bar chart PowerPoint slide that displays both positive and negative values simultaneously. This presentation template uses blue and green color series to clearly visualize multi-series data, making it ideal for pharmaceutical market analysis, sales performance comparison, and profit-loss analysis. The 2-slide set includes a color version for digital presentations and a grayscale version for printing and monochrome projector environments. Delivered in PPTX format with 16:9 widescreen ratio, fully editable and ready to use.
Usage Points
-
Main Usage
This chart is designed to compare contrasting numerical data clearly and effectively. It visualizes datasets containing both positive and negative values (profit-loss, growth-decline, performance variance) intuitively while enabling simultaneous comparison of multiple data series. Particularly useful for market analysis in pharmaceutical, healthcare, financial, and marketing sectors.
-
How to Use
Input your actual data values into the slide, and the chart updates automatically. Use the first color version for online presentations and screen sharing, and the grayscale version for printed materials and monochrome projector environments. Customize the legend, axis labels, and title to match your presentation context.
-
Recommended For
Recommended for marketing professionals, executives, analysts, and consultants presenting market conditions, competitive comparisons, and sales performance analysis. Ideal for business plans, quarterly reports, investor presentations, and proposals requiring data-driven decision-making.
-
Slide Structure
2-slide set: First slide features a multi-series vertical bar chart in blue and green (approximately 12–15 items with mixed positive-negative values); second slide presents the identical structure in grayscale. Each slide includes title, subtitle, and description text areas. Optimized for 16:9 widescreen ratio compatible with modern projectors and monitors.
Related Products
-

Market Analysis Bundle Vertical Bar Graph – Effective Data Visualization
#Market and Competitor Analysis #Graph #Competitor Analysis
-

Paper Theme Table Chart & Bar Graph – Market Analysis and Competitive Strength
#Market and Competitor Analysis #Diagram #Graph
-

Clustered Vertical Bar Graph for Market Analysis – Data Insights
#Market and Competitor Analysis #Graph #Competitor Analysis
-

Startup Company Market Analysis Graph – Competition and Growth
#Market and Competitor Analysis #Diagram #Graph
