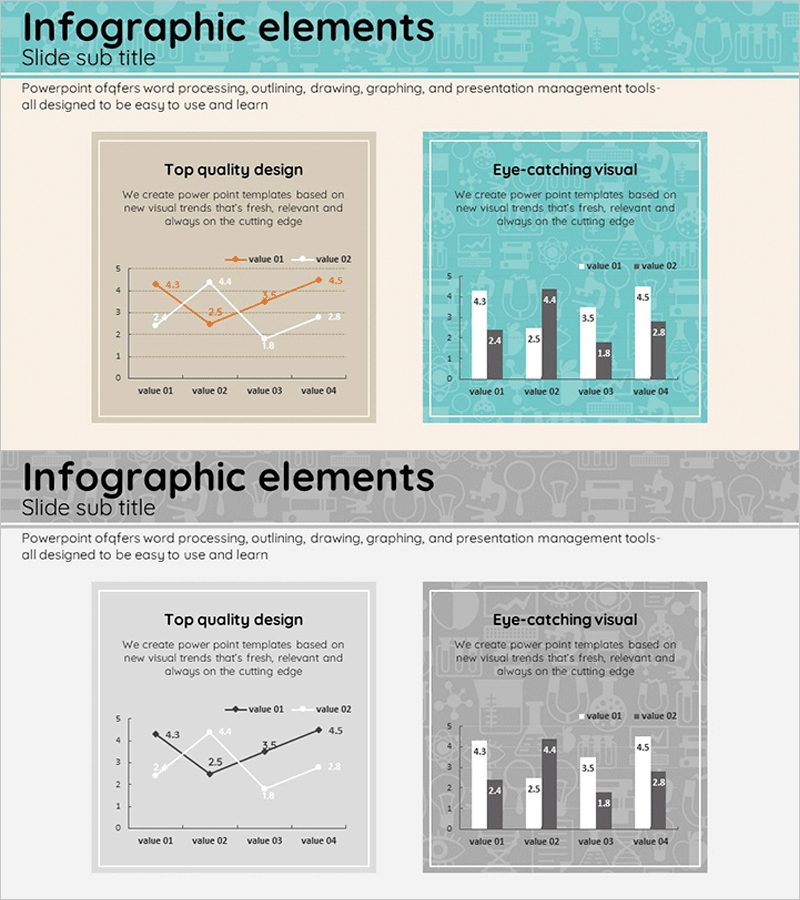
Line Graph and Clustered Column Graph – Essential for Competitor Analysis
RJ0400015_19
- Last Update 05/21/2025
- File Size 1.3MB
- # of Slides 2
- File Format PPTX
- Slide Ratio 16:9
- Color
Keywords
- #Content-Based Slides
- #Design-Based Slides
- #Market and Competitor Analysis
- #Graph
- #Competitor Analysis
- #Market Analysis
- #Column
- #Line
- #Grouped Column
- #Line Chart
- #16:9
- #line graph PowerPoint slide
- #clustered column chart template
- #competitor analysis presentation
- #market analysis chart PPT
- #data visualization PowerPoint template
About the Product
A 2-slide PowerPoint presentation optimized for competitor analysis and market trend comparison. The first slide features an orange line graph displaying trend changes across 4 time periods with 2 data series. The second slide showcases a turquoise-background clustered column chart comparing 4 items with multiple data series. Each slide includes a complete layout with title, description, and legend, allowing you to input data and present immediately. Perfect for presentations, reports, and business decks where numerical comparison and trend visualization are essential.
Usage Points
-
Main Usage
Provides two essential chart types for competitor analysis and market trend presentations. The line graph visualizes trend changes over time, while the clustered column chart enables simultaneous comparison of multiple data series across different items.
-
How to Use
Input your actual data into each chart for immediate use. The line graph works well for quarterly or monthly performance trends, while the clustered column chart is ideal for comparing key metrics across competitors. Customize legends and axis labels to match your presentation context.
-
Recommended For
Marketing, strategy, and finance professionals presenting competitive analysis reports, business plans, and quarterly performance reviews. Particularly effective for market share comparisons, sales trend analysis, and product performance benchmarking where quantitative data must be communicated persuasively.
-
Slide Structure
Slide 1: Orange line graph (2 series, 4 data points) with title and description text box. Slide 2: Turquoise-background clustered column chart (2 series, 4 items) with legend, axis labels, and title area. 16:9 widescreen format, fully editable PPTX with all elements customizable.
Related Products
-

Competitor Capability Analysis Chart – Efficient Market Analysis
#Market and Competitor Analysis #Graph #Competitor Analysis
-

Project Market Environment Analysis Chart – Powerful Competitive Strategy
#Market and Competitor Analysis #Graph #Competitor Analysis
-

Financial Services Market Analysis Graph – Competitor Analysis and Sustainability
#Market and Competitor Analysis #Graph #Competitor Analysis
-

Clustered Vertical Bar Graph Slide – Visualizing Market Analysis
#Market and Competitor Analysis #Diagram #Graph
