Smart Analytics Insight – Market and Competitive Analysis Presentation
RM0700011_5
- Last Update 02/27/2025
- File Size 0.6MB
- # of Slides 4
- File Format PPTX
- Slide Ratio 16:9
- Color
Keywords
- #Content-Based Slides
- #Design-Based Slides
- #Market and Competitor Analysis
- #Graph
- #Text Box
- #Competitor Analysis
- #Market Analysis
- #Column
- #Circles
- #Grouped Column
- #Doughnut Chart
- #Speech Bubble
- #16:9
- #bar chart PowerPoint slide
- #data comparison presentation
- #donut chart PPT
- #market analysis graph
- #competitive analysis slide
- #numerical data visualization
About the Product
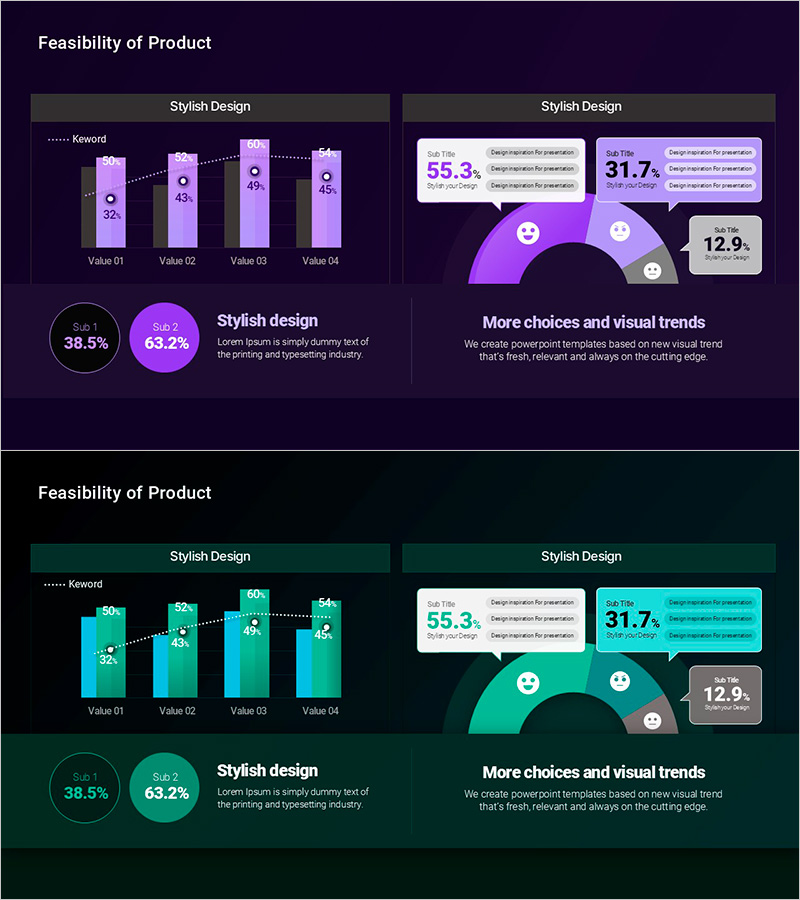
A 4-slide PowerPoint template optimized for market analysis and competitive benchmarking. Features horizontal bar charts, vertical bar charts, donut charts, and grouped bar graphs for comprehensive data visualization. Set against a deep purple background with bright purple accents, it conveys professional credibility. Each slide presents numerical data intuitively, ready for immediate use in presentations and reports. Designed in 16:9 widescreen format for modern displays.
Usage Points
-
Main Usage
Visualize quantitative data such as market size, competitor performance, sales trends, and customer satisfaction through comparative analysis. Combines bar charts and donut charts to support multi-dimensional data interpretation.
-
How to Use
Double-click graph values to replace with actual data. Edit legend and axis labels freely, and adjust colors to match your brand identity without affecting layout.
-
Recommended For
Executive briefings, investor presentations, marketing strategy sessions, and quarterly performance reviews. Ideal for consulting firms, financial institutions, and manufacturers requiring data-driven decision-making materials.
-
Slide Structure
4-slide set: ① Horizontal bar chart (4-item comparison) ② Vertical bar chart (5-item trend) ③ Donut chart (4-segment ratio) ④ Grouped bar chart (2-series comparison). Each slide functions independently.
Related Products
-

Cement Theme Vertical Bar Bundle Graph
#Market and Competitor Analysis #Graph #Competitor Analysis
-

Market Segmentation Analysis Table & Donut Chart for Market Insights
#Market and Competitor Analysis #Diagram #Graph
-

Healthcare Analytics Donut Graph – Visualizing Market Insights
#Market and Competitor Analysis #Graph #Competitor Analysis
-

Business Area Analysis Graph – Suitable for Market and Competitive Analysis
#Market and Competitor Analysis #Diagram #Graph
