Marketing Effectiveness Step-by-Step Analysis Diagram – Business Management and Operations Planning
RM0400012_31
- Last Update 02/18/2025
- File Size 1MB
- # of Slides 2
- File Format PPTX
- Slide Ratio 16:9
- Color
Keywords
- #Content-Based Slides
- #Design-Based Slides
- #Product/Service Introduction
- #Business Management
- #Operational Plan
- #Diagram
- #Program Introduction
- #Implementation Plan
- #Flow
- #Cluster
- #Linear Flow
- #Chain Diagram
- #16:9
- #marketing effectiveness analysis diagram
- #3-step process PowerPoint slide
- #linear flow diagram
- #business management slide template
- #marketing strategy visualization PPT
About the Product
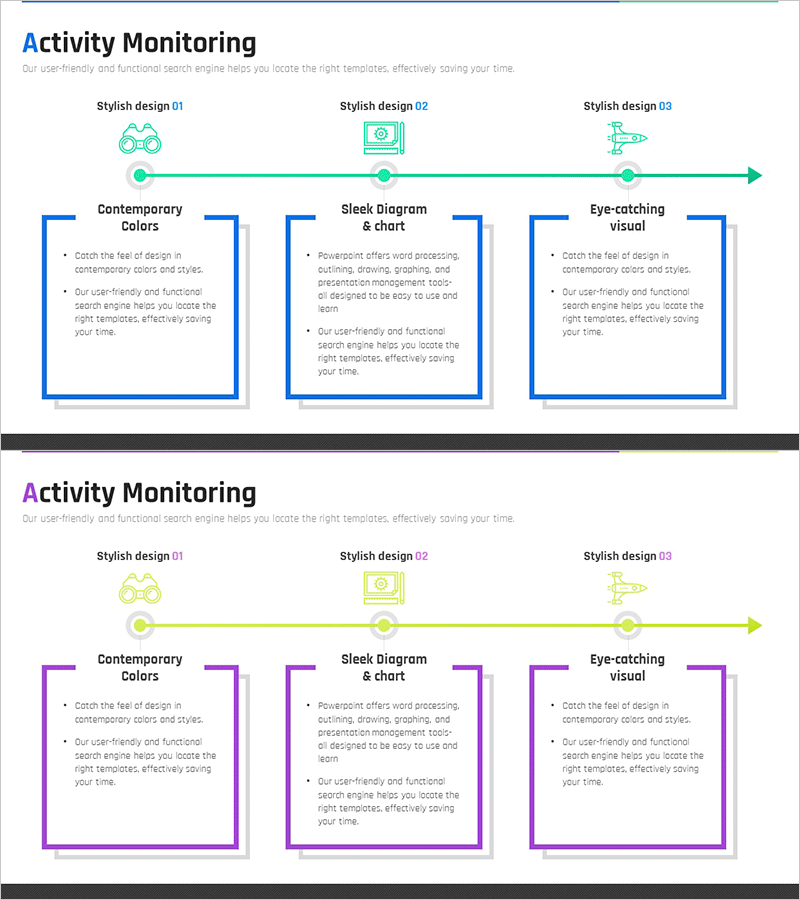
A three-step linear diagram PowerPoint slide that visualizes marketing effectiveness analysis and measurement processes. Connected by teal-colored icons and directional arrows, this slide template clearly represents sequential marketing workflows. Each stage includes dedicated text areas for detailed descriptions, making it ideal for business management, operations planning, and marketing strategy presentations. The 16:9 widescreen format with 2 slides is fully editable and ready to use in corporate reports, marketing proposals, business plans, and strategic presentations.
Usage Points
-
Main Usage
Visualizes marketing effectiveness measurement processes in sequential stages to enhance audience comprehension. The three-step linear flow clearly represents marketing strategy execution → performance measurement → improvement planning, making it ideal for business management and operations planning sections to communicate marketing activity progress and results.
-
How to Use
Click on each stage's icon and text area to edit content. Add or remove stages as needed, and customize colors to match your presentation theme. Insert into marketing proposals, business plans, quarterly performance reports, and strategic presentations to illustrate marketing effectiveness analysis sections.
-
Recommended For
Marketing managers, business operations directors, and executives presenting marketing strategy execution and performance results. Particularly effective in marketing proposals, business plans, investor pitch decks, and quarterly operational reports where step-by-step marketing activity progress needs visual representation.
-
Slide Structure
Consists of 2 slides with 3 nodes per slide (icon + text area) connected by teal directional arrows in linear sequence. First slide features blue-bordered text boxes, second slide uses purple-bordered boxes for stage descriptions. Optimized for 16:9 widescreen format with fully editable elements.
Related Products
-

AI Service Promotion Plan Diagram
#Business Management #Operational Plan #Diagram
-

5-Step Linear Circle Diagram – Business Strategy
#Business Strategy #Business Management #Operational Plan
-

Business Process Arrow Diagram – Systematic Business Management
#Business Management #Operational Plan #Diagram
-

Timeline Chart Visualizing Yearly Changes – Journey of Success
#Company Introduction #Operational Plan #Diagram
