Results Driven Diagram for Business Strategy Presentation – Visual Representation for Goal Achievement
RJ0200001_15
- Last Update 03/28/2025
- File Size 0.1MB
- # of Slides 2
- File Format PPTX
- Slide Ratio 16:9
- Color
Keywords
- #Content-Based Slides
- #Design-Based Slides
- #Marketing Plan and Strategy
- #Diagram
- #Text Box
- #Marketing Objectives
- #Flow
- #Linear Flow
- #Circular Text Box
- #16:9
- #linear flow diagram PowerPoint
- #3-step process flowchart
- #business strategy slide template
- #goal achievement diagram
- #how to create process flow in PowerPoint
About the Product
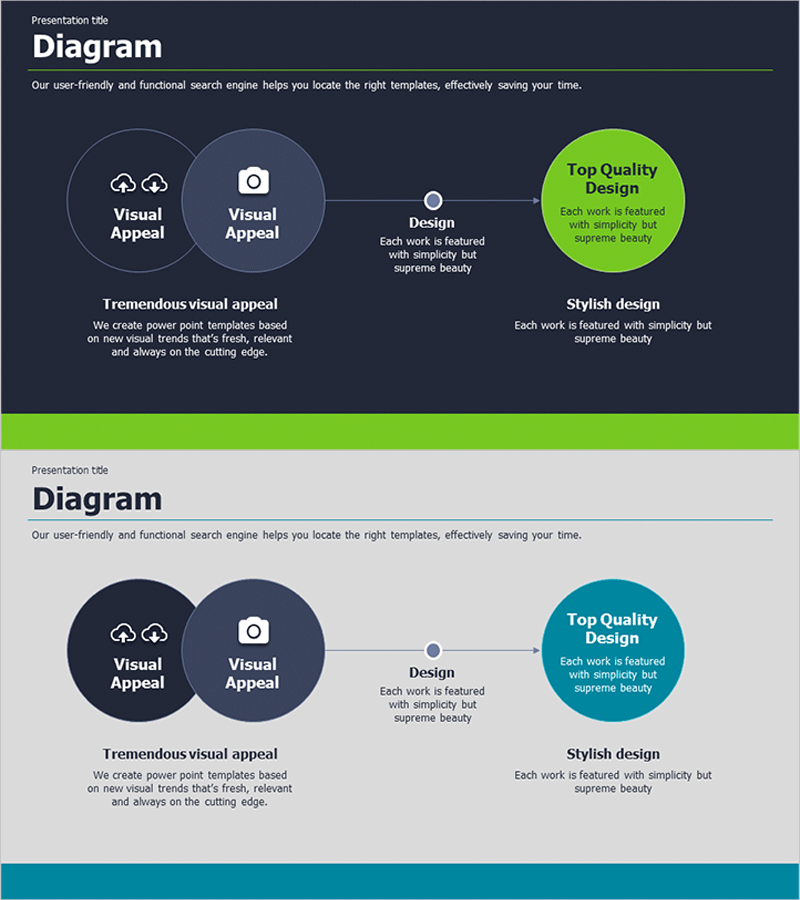
A linear flow diagram PowerPoint slide that visualizes business strategy progression and goal achievement through three sequential stages. Featuring a dark navy background with lime accent color, this 2-slide presentation template uses circular nodes connected by directional arrows to represent cause-and-effect relationships. Each node incorporates icons and text fields to clearly communicate intent, execution, and results. Ideal for strategy presentations, business reports, and operational planning slides that require immediate deployment in corporate settings.
Usage Points
-
Main Usage
Clearly visualize business strategy progression through sequential stages and communicate cause-and-effect relationships to audiences. Effectively emphasize key messages during goal-setting presentations, strategic planning sessions, and operational plan reviews.
-
How to Use
Input initial stage content (intent, vision) in the left two nodes, intermediate stage (strategy, execution) in the center node, and final stage (results, outcomes) in the right lime node. Edit node icons and text to reflect your organization's specific objectives and strategic direction.
-
Recommended For
Executives, strategy managers, and project leaders presenting business plans, strategy reports, and quarterly operational plans. Suitable for investment pitch presentations, management meetings, and organizational strategy alignment sessions where clear goal-achievement pathways must be communicated.
-
Slide Structure
2-slide layout with dark navy background featuring 3 circular nodes (2 navy on left, 1 lime on right) connected by directional arrows showing linear progression. Each node contains icon, title, and description text areas. Optimized for 16:9 widescreen format in PPTX file type.
Related Products
-

Field-Specific Goal Planning Diagram – Efficient Business Strategy Implementation
#Business Strategy #Marketing Plan and Strategy #Diagram
-

Real Estate Marketing System - Actionable Strategies and Flow
#Operational Plan #Marketing Plan and Strategy #Diagram
-

Marketing Goals Flow Diagram – Efficient Strategy Development
#Marketing Plan and Strategy #Diagram #Marketing Objectives
-

Business Goals Diagram – Conceptualizing Business Strategy
#Business Vision and Strategy #Marketing Plan and Strategy #Diagram
