Visualizing Business Strategy with Bar Charts – Market Analysis and Future Outlook
RJ0800016_9
- Last Update 08/04/2025
- File Size 0.3MB
- # of Slides 2
- File Format PPTX
- Slide Ratio 16:9
- Color
Keywords
- #Content-Based Slides
- #Design-Based Slides
- #Market and Competitor Analysis
- #Diagram
- #Graph
- #Future Outlook
- #Market Analysis
- #Cluster
- #Horizontal Bar
- #Combination Diagram
- #Grouped Horizontal Bar
- #16:9
- #horizontal bar chart PowerPoint
- #bar graph presentation slide
- #business analysis template
- #market analysis slide deck
- #data comparison diagram
- #competitive analysis PowerPoint
About the Product
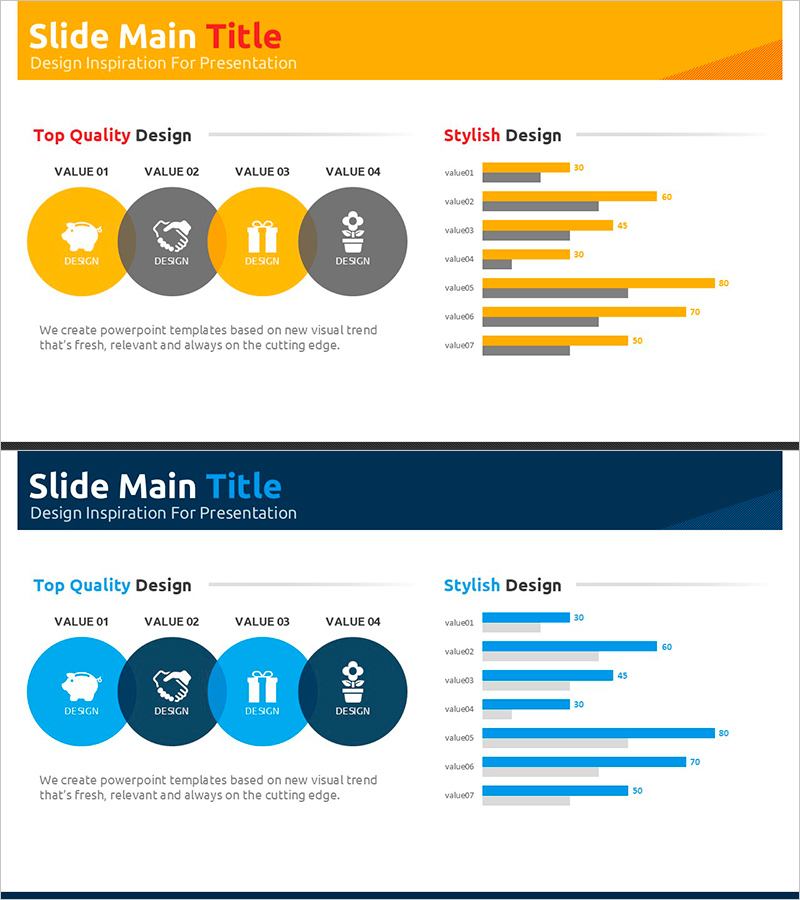
A horizontal bar chart PowerPoint slide set featuring 2 slides designed to visualize business strategy and market analysis. This presentation template uses contrasting gold and gray colors to compare up to 7 data items and display rankings effectively. The layout combines four circular icons at the top (Design, Design, Product, Strategy) with horizontal bar charts below, making it ideal for competitive analysis, market share representation, performance metrics, and future direction planning. Available in 16:9 widescreen PPTX format, fully editable and ready for immediate use in professional presentations.
Usage Points
-
Main Usage
Visualize and compare up to 7 data points such as competitive analysis, market share, sales performance, and key metrics using horizontal bars to clearly communicate business strategy and market insights.
-
How to Use
Enter core categories (Design, Product, Strategy, etc.) in the four circular icon sections at the top, then input actual numerical data into the horizontal bar chart below to create a ready-to-present business analysis slide.
-
Recommended For
Marketing managers, sales directors, executives, management consultants, and business planning teams presenting quarterly performance reports, market analysis briefings, competitive strategy meetings, and investor presentations requiring data-driven decision support.
-
Slide Structure
Slide 1: Gold header + 4 circular icons (VALUE 01–04) + descriptive text / Slide 2: Navy header + 4 circular icons (VALUE 01–04) + 7-item horizontal bar chart (gold and gray palette, 0–80 value range)
Related Products
-

Horizontal Bar Chart for Construction Project Performance Analysis – Stability and Growth
#Market and Competitor Analysis #Diagram #Graph
-

Mobile Market Analysis Graph – Insights on Market Trends
#Market and Competitor Analysis #Diagram #Graph
-

Future Outlook Analysis Graph – Market and Competitive Analysis
#Market and Competitor Analysis #Graph #Other
-

Medical Record Analysis Bar Graph – Market and Competitor Analysis
#Market and Competitor Analysis #Graph #Competitor Analysis
