Horizontal Bar Chart for Financial Business Market Analysis
RJ0300086_31
- Last Update 05/13/2025
- File Size 1.8MB
- # of Slides 2
- File Format PPTX
- Slide Ratio 16:9
- Color
Keywords
- #Content-Based Slides
- #Design-Based Slides
- #Market and Competitor Analysis
- #Graph
- #Competitor Analysis
- #Market Analysis
- #Horizontal Bar
- #Grouped Horizontal Bar
- #16:9
- #horizontal bar chart PowerPoint
- #bar graph slide template
- #financial market analysis chart
- #data comparison PowerPoint slide
- #business analytics presentation template
About the Product
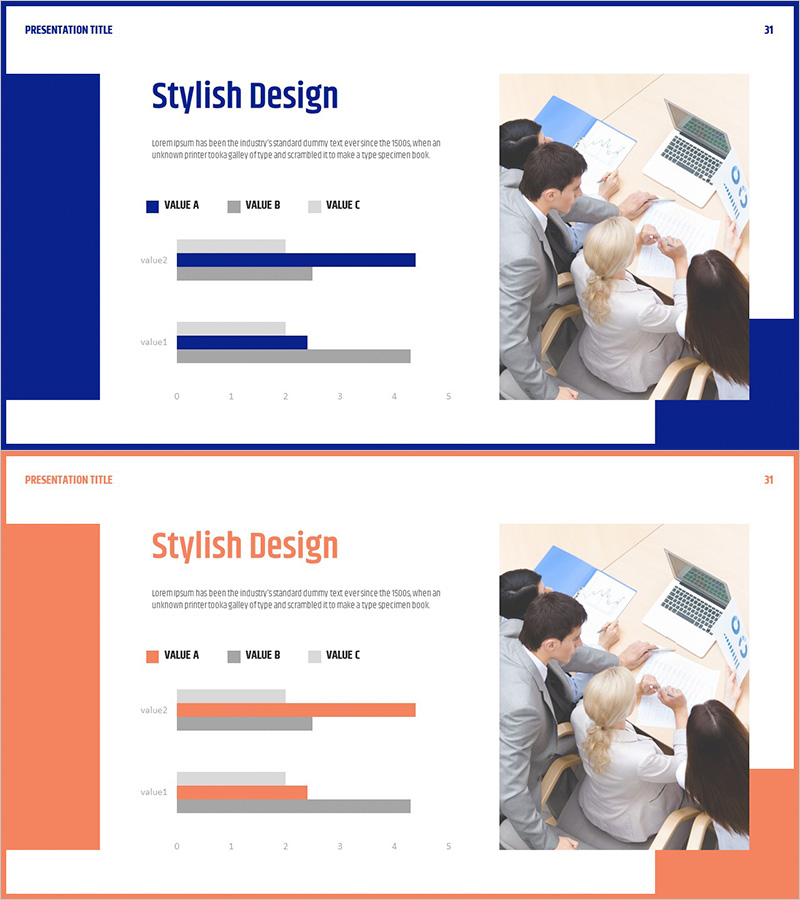
A horizontal bar chart PowerPoint slide designed for financial business market analysis and competitive benchmarking. Features two data series in dark blue and gray tones comparing VALUE A, VALUE B, and VALUE C across two hierarchical levels. Ideal for visualizing market share, financial metrics, competitive positioning, and quantitative performance data with clarity and impact. The 16:9 widescreen format includes 2 slides with fully editable bars, labels, and legend elements for seamless integration into presentations, reports, and business proposals.
Usage Points
-
Main Usage
Visualize quantitative financial and business data using horizontal bar charts to communicate market analysis, competitive comparisons, and financial metrics. The two-level hierarchical structure enables simultaneous comparison of parent and child data points, making it ideal for complex analytical presentations.
-
How to Use
Insert into the market analysis section of executive presentations, competitive analysis pages of business reports, and financial comparison slides of investment proposals. Edit the legend labels and numerical values to match your data, and adjust bar colors and lengths to emphasize key findings or highlight specific metrics.
-
Recommended For
Finance and banking professionals, business analysts, management consultants, marketing and strategy planners, investment relations specialists, corporate executives preparing board reports, and academic researchers presenting quantitative comparative analysis.
-
Slide Structure
Slide 1: Title area + two-series horizontal bar chart (VALUE A in dark blue, VALUE B and C in gray) + legend with color coding / Slide 2: Identical structure for second-level data comparison. Both slides feature a dark blue left sidebar and image area on the right, with 0–5 scale X-axis and VALUE 1–2 Y-axis labels for clear data reference.
Related Products
-

Social Network Business Market Analysis Chart – Effective Data Visualization
#Market and Competitor Analysis #Graph #Competitor Analysis
-

Science Market Analysis Bundled Bar Graph
#Market and Competitor Analysis #Graph #Competitor Analysis
-

Mobile Market Analysis Graph – Insights on Market Trends
#Market and Competitor Analysis #Diagram #Graph
-

Market Analysis Bundle Bar Graph - Effective Competitor Analysis
#Market and Competitor Analysis #Graph #Competitor Analysis
