Sailing Travel Service Company and Competitor Analysis Dual Horizontal Chart
RJ0600072_8
- Last Update 07/09/2025
- File Size 0.3MB
- # of Slides 2
- File Format PPTX
- Slide Ratio 16:9
- Color
Keywords
- #Content-Based Slides
- #Design-Based Slides
- #Market and Competitor Analysis
- #Graph
- #Competitor Analysis
- #Competitive Advantage
- #Horizontal Bar
- #Double Horizontal Bar
- #16:9
- #dual bar chart PowerPoint
- #horizontal bar graph template
- #competitor analysis slide
- #bidirectional bar chart
- #comparison analysis PowerPoint slide
About the Product
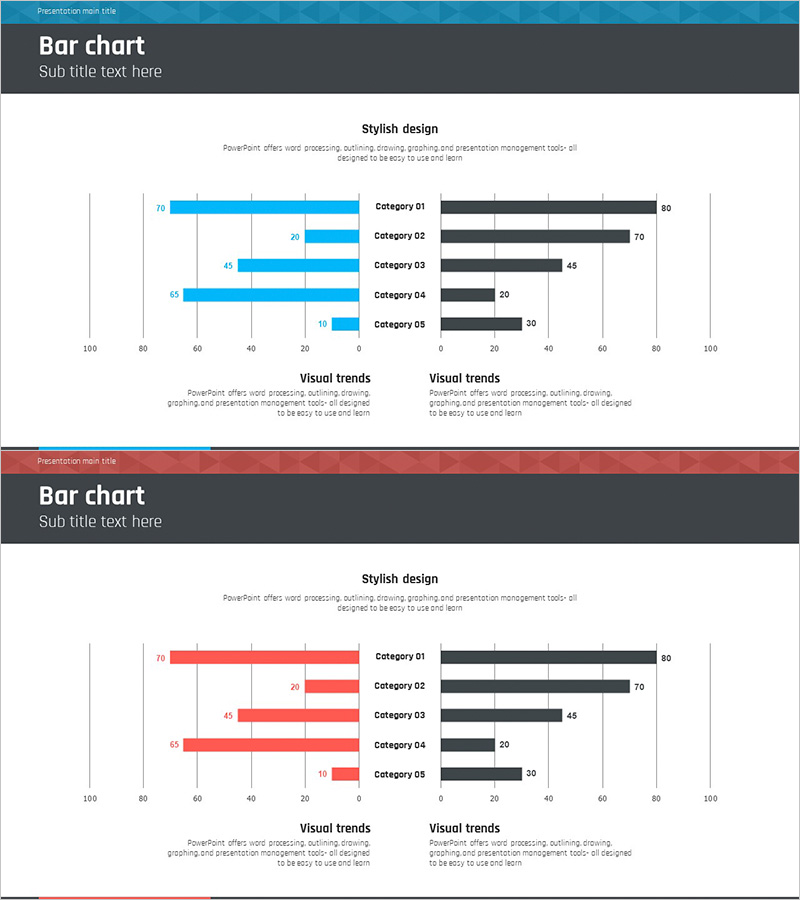
A dual horizontal bar chart PowerPoint slide that compares your company and competitors side-by-side with symmetrical left-right layout. Blue and dark gray bars are positioned on opposite sides of a center axis, enabling intuitive relative comparison. Five categories (Category 01–05) are visualized simultaneously with clear numerical labels on each bar. This presentation slide is ready to use for market analysis, competitive advantage assessment, product performance benchmarking, and service quality evaluation. The 2-slide set includes both blue and red color theme versions for flexible presentation scenarios.
Usage Points
-
Main Usage
Designed to display company and competitor metrics in a symmetrical left-right structure, allowing stakeholders to instantly grasp relative strengths and weaknesses. Ideal for market analysis presentations, competitive positioning reports, product performance benchmarks, and service quality assessments in B2B meetings and strategic decision-making sessions.
-
How to Use
Replace the five category items and numerical values with your own data. Use the blue theme for corporate presentations and formal reports; use the red theme when emphasis or warning messaging is needed. Bar lengths and numerical labels automatically align, so you only need to input your data for instant visualization.
-
Recommended For
Marketing managers, strategy planners, sales executives, consultants, and market analysts preparing competitive analysis reports, business proposals, quarterly performance presentations, and investor pitch decks. Applicable across all industries—travel services, finance, IT, manufacturing—for any comparative analysis scenario.
-
Slide Structure
2-slide set with center-axis symmetry: left side displays blue bars, right side displays dark gray bars, each with 5 items vertically stacked. Numerical labels (70, 29, 45, 65, 15, etc.) appear at bar endpoints; category names (Category 01–05) align on the right. Slide 1 uses blue theme; Slide 2 uses red theme with identical structure and layout.
Related Products
-

Bar Graph for Competitor Analysis – Business Advantage
#Market and Competitor Analysis #Graph #Competitor Analysis
-

Competitor Paired Bar Graph – Market Analysis and Comparison
#Market and Competitor Analysis #Graph #Competitor Analysis
-

Competitor Analysis Thin Bar Graph – Visualizing Market Competitive Advantage
#Market and Competitor Analysis #Graph #Competitor Analysis
-

Horizontal Bar Graph for Cooking Competition
#Market and Competitor Analysis #Graph #Competitor Analysis
