Bar Graph Comparing Exercise Performance by Group
RB0600014_5
- Last Update 03/14/2025
- File Size 0.4MB
- # of Slides 2
- File Format PPTX
- Slide Ratio 4:3
- Color
Keywords
- #Content-Based Slides
- #Design-Based Slides
- #Market and Competitor Analysis
- #Graph
- #Competitor Analysis
- #Competitive Advantage
- #Horizontal Bar
- #Double Horizontal Bar
- #4:3
- #diverging bar chart PowerPoint
- #left-right comparison chart slide
- #symmetrical bar graph template
- #4-item data comparison PPT
- #bar chart PowerPoint template download
About the Product
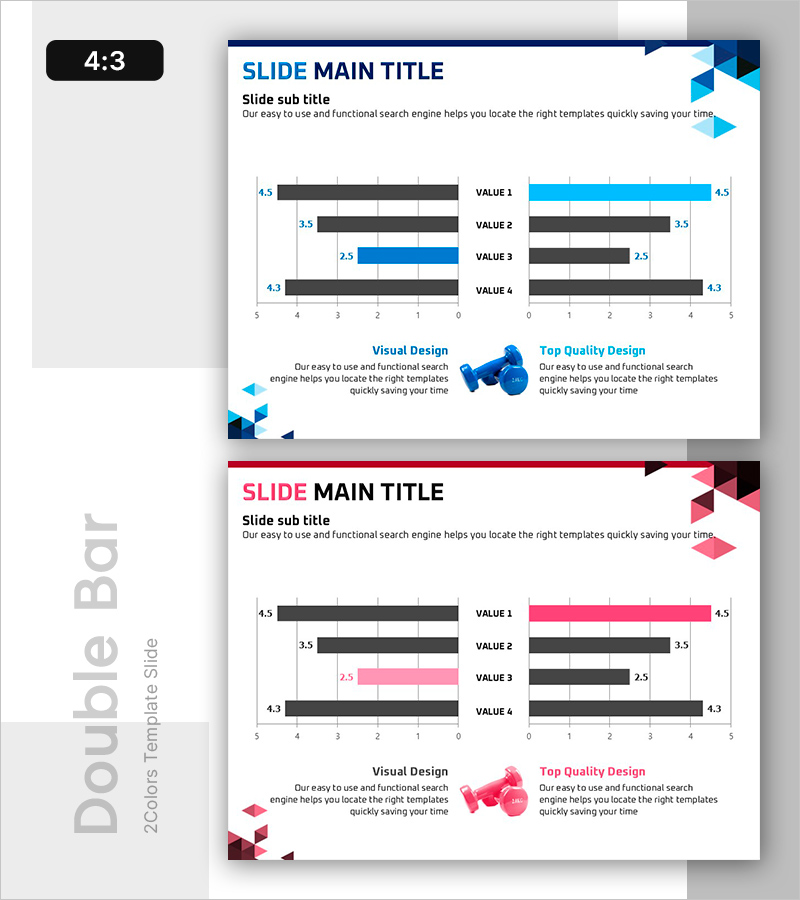
A diverging bar chart PowerPoint slide comparing four data items in symmetrical left-right format. The chart uses navy, light blue, pink, and dark gray bars to distinguish data series, with negative values extending leftward and positive values extending rightward for effective contrast analysis. Numerical labels are clearly displayed for each item, making it ready for immediate use in presentations and reports. The 2-slide set offers multiple color variations and is compatible with all presentation environments in 4:3 PPTX format.
Usage Points
-
Main Usage
Enables intuitive comparison of two groups or two time periods across multiple items. Ideal for competitive performance analysis, year-over-year results comparison, departmental target vs. actual performance evaluation, and any symmetrical data visualization requiring direct contrast.
-
How to Use
Replace the VALUE 1-4 item names and numerical values with your own data. Adjust the length of left-side (negative) and right-side (positive) bars to represent the magnitude differences between comparison targets. Color schemes can be maintained or customized to match your presentation theme.
-
Recommended For
Marketing analysis, sales performance reporting, operational performance evaluation, executive reports, academic presentations, and consulting proposals. Recommended for professionals including marketers, data analysts, executives, and researchers who need quantitative comparisons between two subjects.
-
Slide Structure
2-slide set. Each slide contains a diverging bar chart with 4 items (VALUE 1-4) symmetrically arranged with left axis (0 to -5) and right axis (0 to 5). Four data series represented by navy, light blue, pink, and dark gray bars. Numerical labels displayed on the right of each item. Includes title and subtitle area at top and descriptive text area at bottom.
Related Products
-

Competitor Paired Bar Graph – Market Analysis and Comparison
#Market and Competitor Analysis #Graph #Competitor Analysis
-

Cement Theme Competitor Analysis Graph – Market Insights
#Market and Competitor Analysis #Graph #Competitor Analysis
-

Competitive Comparison Analysis Bar Graph – Visualizing Market Advantage
#Market and Competitor Analysis #Graph #Competitor Analysis
-

Competitor Analysis and Competitive Advantage Double Bar Chart
#Market and Competitor Analysis #Graph #Competitor Analysis
