Bar Chart Analysis of Gardening Activities Trend – Performance and Competitive Advantage
RJ0600103_5
- Last Update 07/19/2025
- File Size 1MB
- # of Slides 2
- File Format PPTX
- Slide Ratio 16:9
- Color
Keywords
- #Content-Based Slides
- #Design-Based Slides
- #Business Strategy
- #Market and Competitor Analysis
- #Diagram
- #Graph
- #Achievements
- #Competitive Advantage
- #Cluster
- #Horizontal Bar
- #Closed Cluster Diagram
- #Horizontal Bar Chart
- #16:9
- #horizontal bar chart PowerPoint
- #bar graph slide template
- #year-over-year performance comparison
- #data visualization presentation
- #how to create bar chart in PowerPoint
About the Product
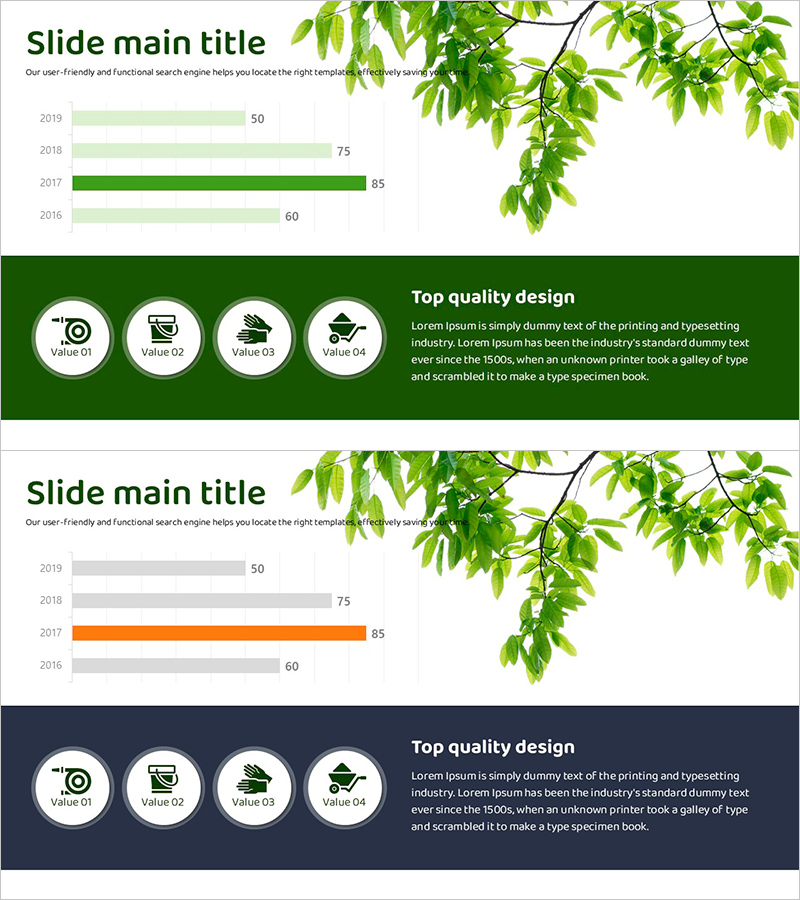
A horizontal bar chart PowerPoint slide that visualizes gardening activity performance across four years (2019-2016) with comparative analysis. The design uses dark green accent bars to highlight peak performance years, complemented by light green supporting bars and clear numerical labels for easy data interpretation. This presentation template is ready to use in business reports, performance analysis documents, and executive presentations. Fully editable slide deck with 16:9 aspect ratio in PPTX format.
Usage Points
-
Main Usage
Presents year-over-year performance metrics using horizontal bar charts to clearly communicate trends and competitive advantages. Applicable to sales figures, productivity metrics, customer satisfaction scores, and other quantitative comparisons across multiple periods.
-
How to Use
Two-slide deck: Slide 1 features a 4-year horizontal bar chart with dark green highlights and light green supporting bars with numerical labels. Slide 2 includes a dark green section with 4 circular icons and descriptive text. All data values and text are fully editable to match your presentation content.
-
Recommended For
Marketing managers, sales directors, project leaders, and executives presenting quarterly or annual performance reviews. Ideal for business plans, performance reports, investor presentations, and strategic planning documents.
-
Slide Structure
Slide 1: Horizontal bar chart displaying 2019-2016 data with dark green accent bar and light green supporting bars, numerical value labels / Slide 2: Dark green background section with 4 circular icons (Value 01-04) and right-aligned text description area, unified green color scheme
Related Products
-

Horizontal Bar Graph of Component Analysis Results
#Business Strategy #Market and Competitor Analysis #Graph
-

Market Analysis Chart for Frequently Used Transportation Methods When Traveling
#Business Strategy #Market and Competitor Analysis #Graph
-

Performance Analysis of the Second-Ranked Item – Towards Successful Strategies
#Business Strategy #Market and Competitor Analysis #Graph
-

Eco-friendly Icon Bar Graph – Effective Visualization for Market Analysis
#Business Strategy #Market and Competitor Analysis #Graph
