Performance Analysis of the Second-Ranked Item – Towards Successful Strategies
RB0500009_3
- Last Update 03/13/2025
- File Size 4.4MB
- # of Slides 2
- File Format PPTX
- Slide Ratio 4:3
- Color
Keywords
- #Content-Based Slides
- #Design-Based Slides
- #Business Strategy
- #Market and Competitor Analysis
- #Graph
- #Achievements
- #Competitive Advantage
- #Horizontal Bar
- #Horizontal Bar Chart
- #4:3
- #horizontal bar chart PowerPoint
- #bar graph slide template
- #performance comparison chart
- #data visualization presentation
- #5-item chart download
About the Product
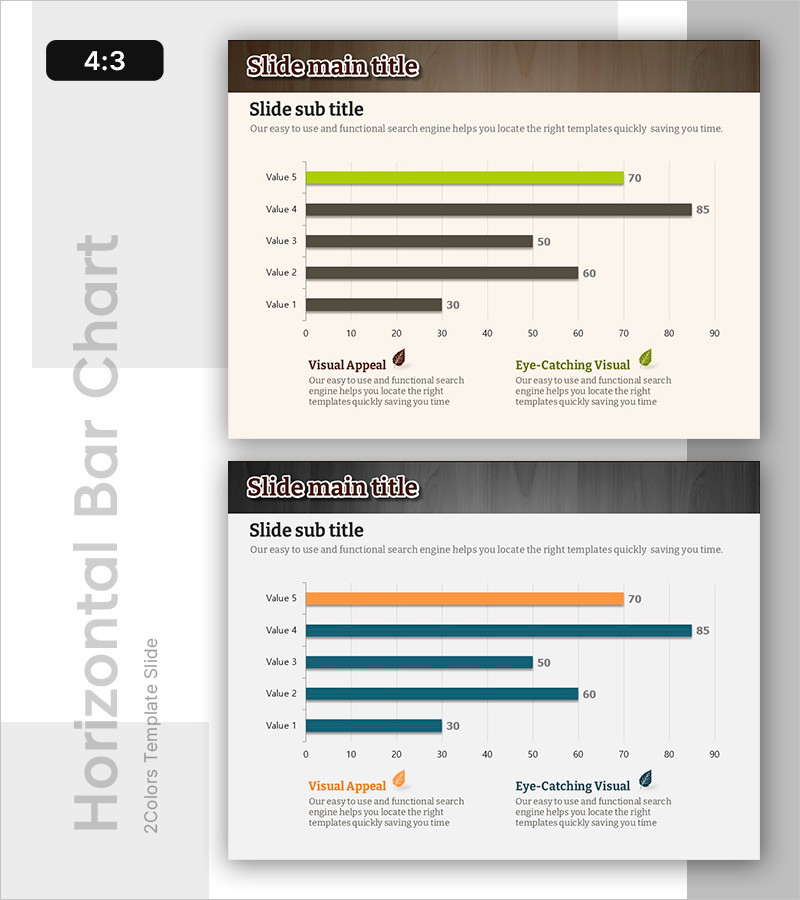
A PowerPoint slide featuring a horizontal bar chart comparing five data values across a 0–90 scale. The design uses three color schemes: green, gray, and orange to differentiate data layers and highlight key metrics. Each bar clearly displays numerical values, making it ideal for business reports, performance analysis, competitive benchmarking, and strategic presentations. The 4:3 aspect ratio template spans 2 slides and is fully editable for immediate use.
Usage Points
-
Main Usage
Visualize five numerical data points using horizontal bars to enable clear performance comparison, ranking, and competitive analysis. The bar length intuitively conveys numerical differences, making it essential for reports, strategy presentations, and market analysis materials.
-
How to Use
Insert this slide in the business strategy or performance analysis section to compare competitor metrics, market share, product sales, or departmental KPIs. Edit bar lengths and values with your own data and deploy immediately in presentations without additional design work.
-
Recommended For
Marketing managers, business analysts, sales directors, and financial professionals presenting performance metrics, competitive strategies, and quarterly results. Ideal for business plans, performance reports, investor pitch decks, and proposal documents.
-
Slide Structure
2-slide template. Slide 1 uses green and gray bars (Value 1–5, range 30–85). Slide 2 uses orange and teal bars for the same 5 items. Both slides include Visual Appeal and Eye-Catching Visual annotation areas at the bottom.
Related Products
-

Eco-friendly Icon Bar Graph – Effective Visualization for Market Analysis
#Business Strategy #Market and Competitor Analysis #Graph
-

Bar Chart Analysis of Gardening Activities Trend – Performance and Competitive Advantage
#Business Strategy #Market and Competitor Analysis #Diagram
-

Bar Chart of Coffee Exports – Comparison and Performance
#Business Strategy #Market and Competitor Analysis #Graph
-

Horizontal Bar Graph of Component Analysis Results
#Business Strategy #Market and Competitor Analysis #Graph
