Customer Behavior Analysis by Country – Strategic Business Proposal
RB0100054_6
- Last Update 03/06/2025
- File Size 7.4MB
- # of Slides 2
- File Format PPTX
- Slide Ratio 4:3
- Color
Keywords
- #Content-Based Slides
- #Design-Based Slides
- #Business Strategy
- #Market and Competitor Analysis
- #Diagram
- #Graph
- #Achievements
- #Customer Analysis
- #Cluster
- #Horizontal Bar
- #Closed Cluster Diagram
- #Horizontal Bar Chart
- #4:3
- #horizontal bar chart PowerPoint
- #customer analysis slide template
- #data comparison chart
- #market analysis graph
- #business strategy presentation
About the Product
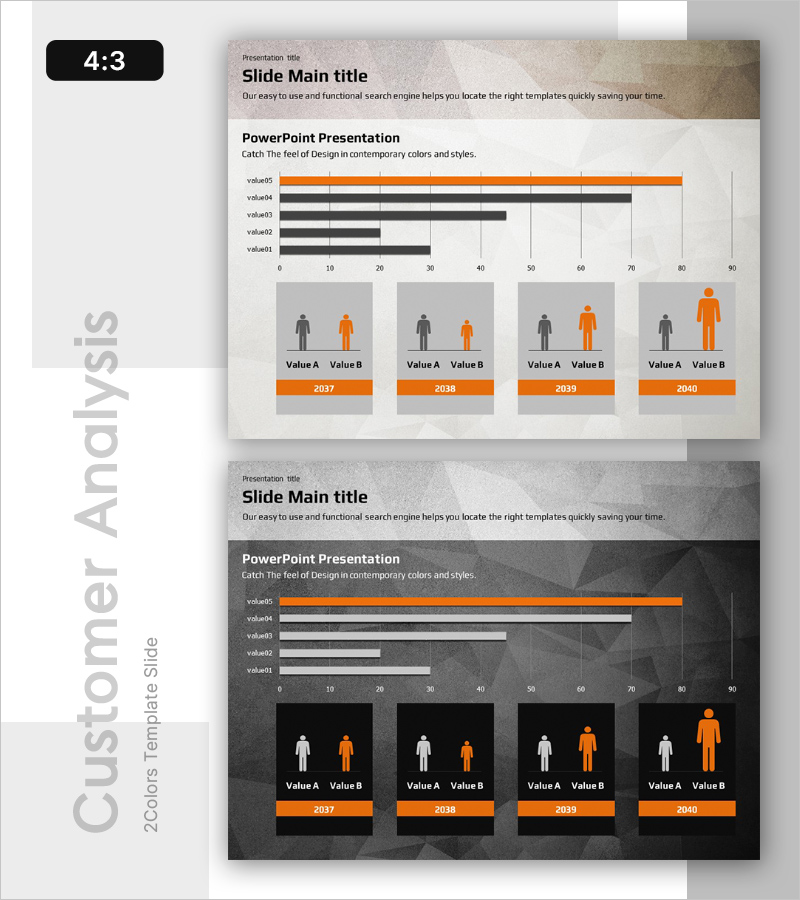
A horizontal bar chart PowerPoint slide designed for customer behavior analysis by country and region. The slide features five data items displayed as horizontal bars for easy comparison, with a lower section showing year-over-year customer demographics (2037–2040) using male and female icons. The beige-toned background with orange accent color emphasizes data hierarchy and key metrics. This presentation template is ready to use for business strategy proposals, market analysis, and customer segmentation presentations.
Usage Points
-
Main Usage
Visualize and compare numerical data across countries, regions, or customer segments using a horizontal bar chart format. Display year-over-year customer behavior trends and demographic shifts to support business strategy development and market positioning discussions.
-
How to Use
Enter your five data values into the horizontal bar chart section at the top to display comparative metrics. Use the four year-based sections below (2037–2040) to show customer demographics by gender using the provided icons. Edit text labels and values to customize the slide for your specific presentation needs.
-
Recommended For
Marketing managers, business strategy teams, market research analysts, and sales professionals presenting customer behavior analysis, market segmentation, and year-over-year performance trends. Suitable for business proposals, strategic reports, investor presentations, and quarterly business reviews.
-
Slide Structure
Top section: horizontal bar chart with 5 data items (value01–value05), scale 0–90 with grid lines / Bottom section: 4 year-based panels (2037–2040), each with male and female icons, orange-highlighted year labels
Related Products
-

Horizontal Bar Chart for Professional Team Human Resources Analysis
#Company Introduction #Market and Competitor Analysis #Diagram
-

Bar Chart Analysis of Gardening Activities Trend – Performance and Competitive Advantage
#Business Strategy #Market and Competitor Analysis #Diagram
-

Introducing Medical Staff Analysis Data – Insights from Experts
#Company Introduction #Market and Competitor Analysis #Diagram
-

Work Capabilities Analysis Diagram – Analysis of Key Personnel Work Performance
#Company Introduction #Market and Competitor Analysis #Diagram
