Eco-friendly Icon Bar Graph – Effective Visualization for Market Analysis
RJ0600026_24
- Last Update 06/27/2025
- File Size 0.3MB
- # of Slides 2
- File Format PPTX
- Slide Ratio 16:9
- Color
Keywords
- #Content-Based Slides
- #Design-Based Slides
- #Business Strategy
- #Market and Competitor Analysis
- #Graph
- #Achievements
- #Competitive Advantage
- #Horizontal Bar
- #Horizontal Bar Chart
- #16:9
- #horizontal bar chart PowerPoint
- #bar graph slide template
- #data comparison chart
- #market analysis visualization
- #how to create bar chart in PowerPoint
About the Product
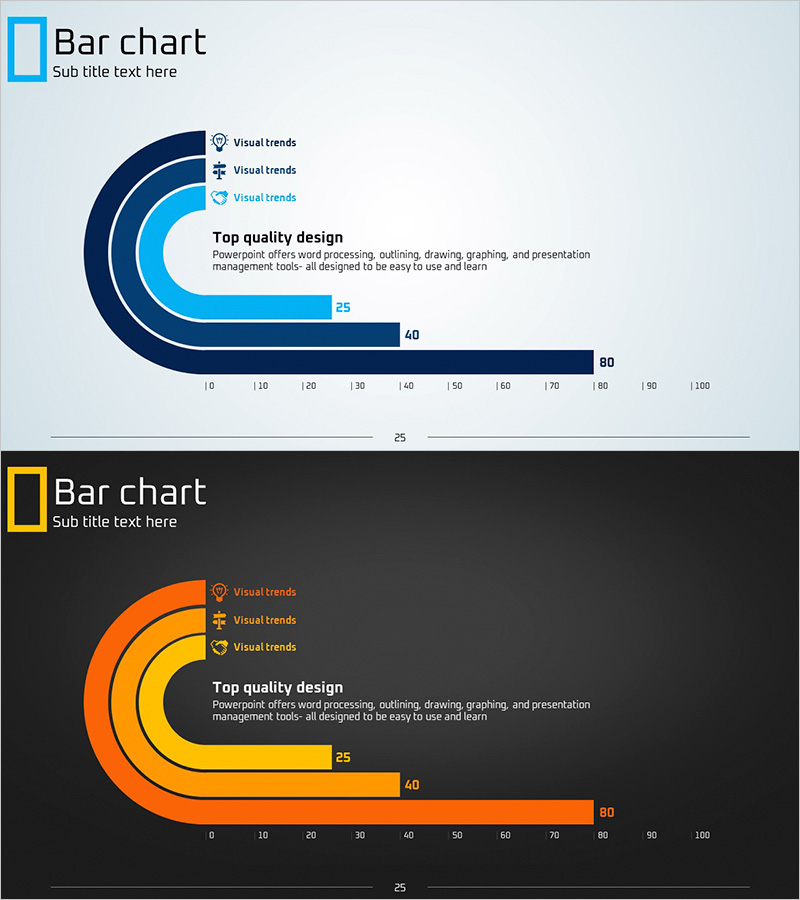
A horizontal bar chart PowerPoint slide designed for market analysis and performance comparison. This data visualization template features three data series in navy blue, light blue, and orange, allowing simultaneous comparison of up to three metrics across multiple categories. Each bar displays numerical labels for precise information delivery, with icons and legends clearly distinguishing data categories. Two background versions—light and dark—are provided to suit different presentation environments. The 16:9 widescreen format includes 2 slides ready for immediate editing and customization.
Usage Points
-
Main Usage
Optimized for comparing three metrics side-by-side and displaying rankings visually. Effectively communicates quantitative data such as market share, sales volume comparisons, performance indicators, and budget allocation across categories.
-
How to Use
Replace bar lengths and numerical labels with your own data values. Modify legend icons and text to define your categories, and adjust colors as needed. Use the light background version for bright environments and the dark version for low-light presentation settings.
-
Recommended For
Marketing managers, sales directors, data analysts, and executives presenting market conditions, competitive analysis, quarterly performance, and regional sales figures. Ideal for consulting proposals, business reports, and strategic planning presentations.
-
Slide Structure
Each slide contains a title area, a legend with three icons and labels, and three horizontal bar series. Bars are positioned along a 0–100 horizontal scale with numerical values displayed at bar ends. Both slides share identical structure with only background color variation.
Related Products
-

Bar Chart Visualizing Coffee Preference Survey Results
#Business Strategy #Market and Competitor Analysis #Graph
-

Bar Chart Analysis of Gardening Activities Trend – Performance and Competitive Advantage
#Business Strategy #Market and Competitor Analysis #Diagram
-

Performance Analysis of the Second-Ranked Item – Towards Successful Strategies
#Business Strategy #Market and Competitor Analysis #Graph
-

Horizontal Bar Graph of Component Analysis Results
#Business Strategy #Market and Competitor Analysis #Graph
