Orange Vertical Bar Chart for Market Growth Visualization – Competitive Advantage Analysis
RJ0600100_16
- Last Update 07/18/2025
- File Size 0.4MB
- # of Slides 2
- File Format PPTX
- Slide Ratio 16:9
- Color
Keywords
- #Content-Based Slides
- #Design-Based Slides
- #Market and Competitor Analysis
- #Diagram
- #Graph
- #Future Outlook
- #Competitive Advantage
- #Cluster
- #Column
- #Closed Cluster Diagram
- #Segmented Column
- #16:9
- #vertical bar chart PowerPoint
- #bar graph slide template
- #market analysis chart
- #competitive comparison
- #growth visualization
- #how to create bar chart in PowerPoint
About the Product
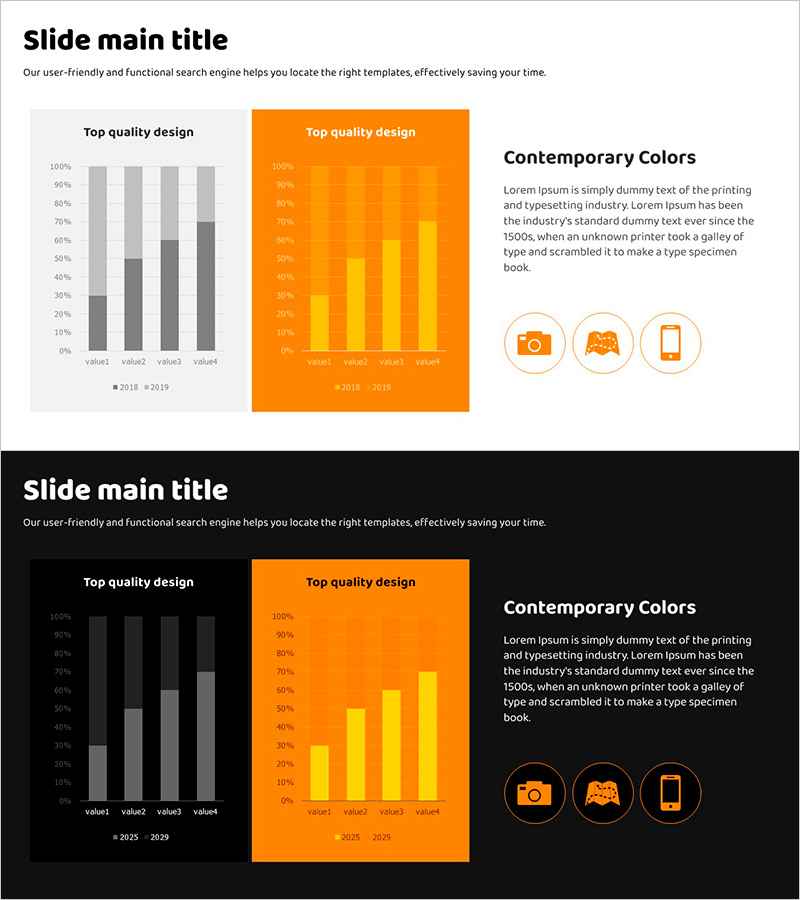
A vertical bar chart PowerPoint slide designed for market analysis and competitive comparison presentations. Features bright orange gradient bars visualizing year-over-year growth across four data items. The 2-slide set includes both white and black background versions for flexible presentation environments. The layout contrasts gray reference bars on the left with orange emphasis bars on the right, effectively highlighting data changes and performance gaps. Ideal for executive reports, quarterly earnings presentations, market trend analysis, and strategic planning sessions requiring data-driven insights.
Usage Points
-
Main Usage
Optimized for comparing year-over-year metrics and visualizing market growth trends with clarity and impact. The orange gradient bars paired with gray reference bars create strong visual contrast that emphasizes key performance differences. Perfect for executive briefings, quarterly reports, and strategic market analysis where data credibility is essential.
-
How to Use
Input baseline data in the left gray bar graph and comparison data in the right orange emphasis graph. Adjust bar heights and colors to reflect your numerical values, then customize legend labels and axis titles to match your presentation context. Select either the white or black background version based on your venue lighting and corporate branding requirements.
-
Recommended For
Executives and C-suite presenting quarterly performance metrics, marketing teams analyzing market share and competitive positioning, sales teams comparing regional or product performance, finance teams presenting growth rate analysis, and strategy teams requiring data-backed decision-making across all departments.
-
Slide Structure
2-slide set with Slide 1 featuring white background, left-aligned gray 4-item bar graph, and right-aligned orange 4-item emphasis graph in 2-column layout. Slide 2 mirrors the structure on black background with orange gradient bars. Both slides include title area, legend (2025·2029), Y-axis percentage scale (0–100%), and X-axis item labels (value1–value4).
Related Products
-

Analysis of Reading Volume by Data – Market Status and Competitive Advantage
#Market and Competitor Analysis #Diagram #Graph
-

Graph of Car Type Analysis by Year – Market Insights
#Product/Service Introduction #Market and Competitor Analysis #Diagram
-

System Learning Data Graph – Clear Market Analysis
#Market and Competitor Analysis #Diagram #Graph
-

Blue Line Wide Template Vertical Bar Chart – Market Status Analysis
#Market and Competitor Analysis #Graph #Market Status
