Analysis of Reading Volume by Data – Market Status and Competitive Advantage
RJ0500041_14
- Last Update 06/18/2025
- File Size 0.3MB
- # of Slides 2
- File Format PPTX
- Slide Ratio 16:9
- Color
Keywords
- #Content-Based Slides
- #Design-Based Slides
- #Market and Competitor Analysis
- #Diagram
- #Graph
- #Future Outlook
- #Competitive Advantage
- #Cluster
- #Line
- #Closed Cluster Diagram
- #Line Chart
- #16:9
- #line chart PowerPoint slide
- #data trend presentation template
- #market analysis chart
- #competitive comparison graph
- #4-series line chart download
About the Product
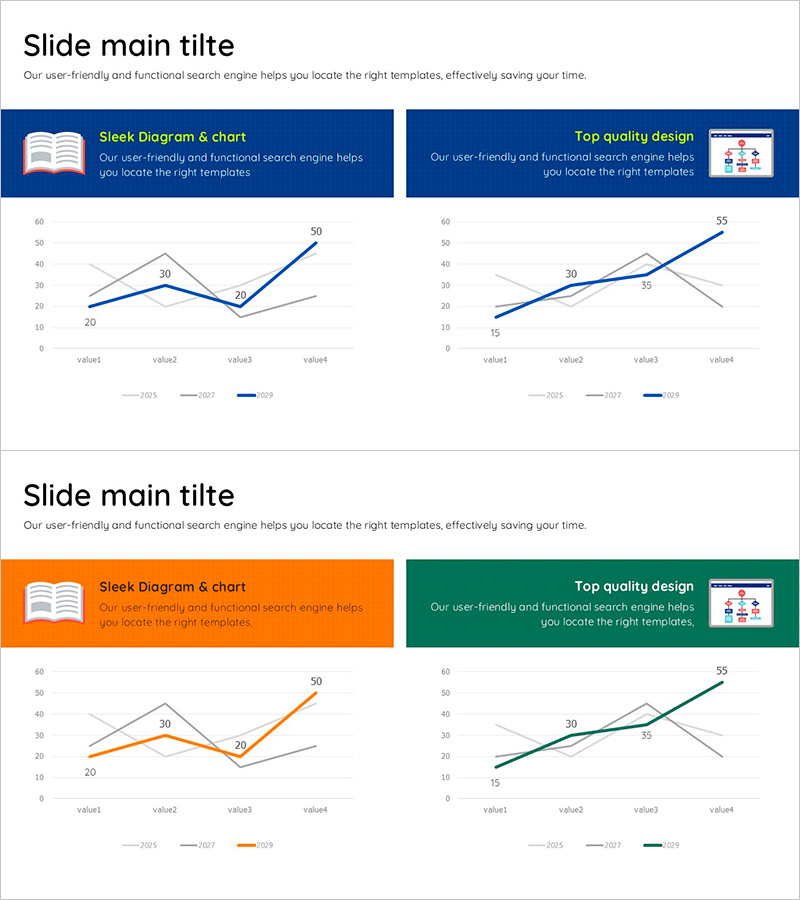
A line chart PowerPoint slide designed for market analysis and competitive advantage comparison. This presentation template visualizes four data series to clearly show trends and changes over time. The design features a dark blue primary color with gray reference lines in a minimal layout, with numeric labels for precise data communication. Ideal for business presentations including reading volume analysis, market status assessment, and competitor benchmarking. Ready to download and edit directly in PowerPoint for immediate use.
Usage Points
-
Main Usage
Visualizes data changes over time to effectively communicate market conditions, competitor analysis, and performance metrics. The four-series comparison structure enables complex data representation, while numeric labels ensure accurate information delivery and audience comprehension.
-
How to Use
Insert into business reports, marketing plans, and market analysis presentations in the data section. Effectively represents time-based data such as reading volume trends, sales changes, and customer satisfaction metrics. Directly edit data in PowerPoint to customize with your own figures and update in real time.
-
Recommended For
Recommended for marketing professionals, executives, analysts, and consultants who base decisions on data. Particularly useful for market analysis presentations, competitive advantage analysis, performance reporting, and trend analysis discussions.
-
Slide Structure
Two-slide template, each containing a 4-series line chart. Features X-axis with 4 data points (value1–value4), Y-axis scale from 0–60, and three time periods (2025·2027·2029) or period-based series indicators to clearly represent change trends.
Related Products
-

Service Analysis Line Graph – Visualization of Competitive Advantage
#Market and Competitor Analysis #Diagram #Graph
-

Mobile Service Technology Analysis Graph – Market and Competitor Analysis
#Market and Competitor Analysis #Diagram #Graph
-

Orange Vertical Bar Chart for Market Growth Visualization – Competitive Advantage Analysis
#Market and Competitor Analysis #Diagram #Graph
-

Social Network Market Competitor Analysis PPT – Data Driven Competitive Advantage
#Market and Competitor Analysis #Diagram #Graph
