System Learning Data Graph – Clear Market Analysis
RJ0500038_29
- Last Update 06/17/2025
- File Size 0.4MB
- # of Slides 2
- File Format PPTX
- Slide Ratio 16:9
- Color
Keywords
- #Content-Based Slides
- #Design-Based Slides
- #Market and Competitor Analysis
- #Diagram
- #Graph
- #Other
- #Competitive Advantage
- #Cluster
- #Closed Cluster Diagram
- #16:9
- #closed cluster diagram PowerPoint
- #system learning data slide template
- #hierarchical structure diagram
- #market analysis PowerPoint slide
- #data flow visualization PPT
About the Product
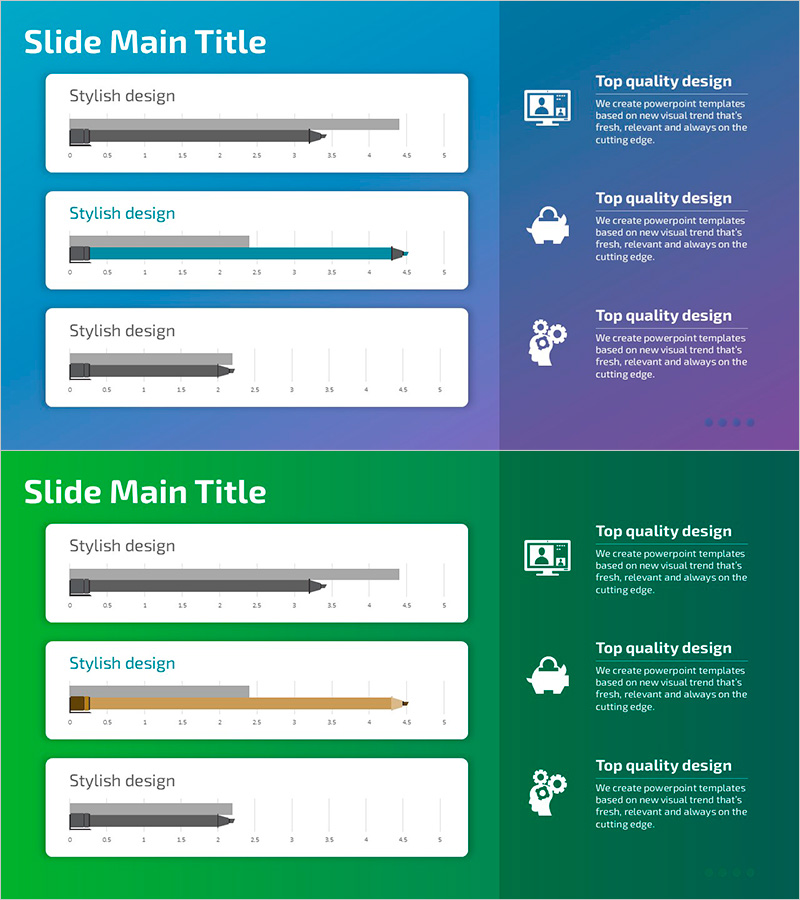
A closed cluster diagram PowerPoint slide that visualizes system learning data and market analysis through a hierarchical three-level structure. The design expands from a central core concept outward with arrow connectors that clearly represent data flow and interdependencies. Set against a blue-to-navy gradient background with gray bar graph elements and directional arrows, this slide is optimized for market analysis, competitive advantage assessment, and technology architecture presentations. The 2-slide set accommodates multiple data scenarios, and the 16:9 widescreen format ensures seamless integration into modern presentation environments.
Usage Points
-
Main Usage
Expresses hierarchical data structures such as system learning data, market analysis, and competitive advantage through a closed cluster format, intuitively conveying relationships between core concepts and detailed elements. Ideal for technology explanations, business strategy presentations, and data-driven decision-making communications.
-
How to Use
Enter the core concept in the center node, then populate the three expansion zones with detailed data. Follow the arrow direction for top-down or bottom-up explanations. Replace bar graph values with actual data to strengthen quantitative analysis, and adjust colors to differentiate categories as needed.
-
Recommended For
Data analysts, business strategy teams, IT architects, marketing planners, and executives preparing analytical reports. Particularly effective when explaining complex system structures or multi-layered data in a clear, simplified manner.
-
Slide Structure
2-slide set. Each slide features a closed cluster structure expanding from a central core node in three directions, with gray bar graphs and text input areas in each expansion zone. Arrow connectors link nodes, and a unified blue-toned background maintains visual hierarchy throughout.
Related Products
-

Business Program Analysis Area Graph – Competitive Edge
#Market and Competitor Analysis #Diagram #Graph
-

Competitive Strengths Comparison Chart – An Effective Market Analysis Tool
#Product/Service Introduction #Market and Competitor Analysis #Diagram
-

Camera Donut Chart and Table – Market and Competitive Analysis
#Product/Service Introduction #Market and Competitor Analysis #Graph
-

Bar Chart Visualizing Yacht Tour Satisfaction
#Market and Competitor Analysis #Graph #Other
