Modern Graph Slide Template for Data Visualization
RJ0600093_18
- Last Update 07/15/2025
- File Size 0.2MB
- # of Slides 2
- File Format PPTX
- Slide Ratio 16:9
- Color
Keywords
- #Content-Based Slides
- #Design-Based Slides
- #Financial Plans and Performance
- #Diagram
- #Graph
- #Capital Requirements
- #Budget
- #Tax Strategy and Benefits
- #Cluster
- #Column
- #Closed Cluster Diagram
- #Segmented Column
- #16:9
- #stacked bar chart PowerPoint
- #data visualization slide template
- #multi-series chart PowerPoint
- #how to create stacked bar chart in PowerPoint
- #comparison analysis slide download
About the Product
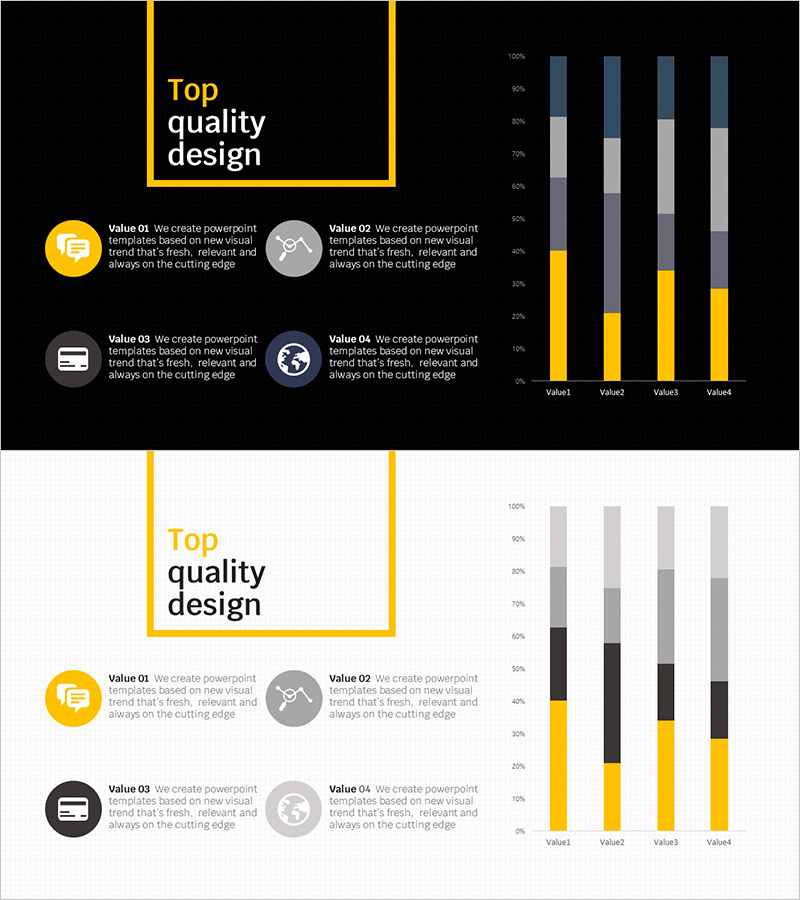
A stacked bar chart PowerPoint slide designed for effective data visualization and multi-series comparison. The template features four data items (Value1 through Value4) with four distinct data series represented in black, gray, yellow, and blue colors. The 2-slide layout includes a title slide with yellow accent border and a data visualization slide with fully editable chart elements. Optimized for 16:9 widescreen format, this presentation template is ideal for business reports, financial analysis, and performance reviews.
Usage Points
-
Main Usage
Visualize complex multi-series data by displaying both the composition ratio and comparative values across categories simultaneously. Ideal for showing sales breakdown, cost allocation, revenue distribution, and departmental performance metrics in a single, easy-to-understand chart.
-
How to Use
Use in financial reports, quarterly performance reviews, and budget variance analysis sections. Perfect for investor presentations, executive briefings, and marketing analytics where multiple data streams need to be compared side-by-side. Easily customize values and labels to match your specific data.
-
Recommended For
Finance professionals, data analysts, marketing managers, and business executives presenting quantitative results. Recommended for quarterly earnings reports, departmental performance comparisons, product line analysis, and budget allocation presentations.
-
Slide Structure
2-slide template with title slide featuring black background and yellow accent border, followed by data visualization slide. The chart displays 4 items (Value1-Value4) with 4 stacked data series each, reaching 100% total height. Each series uses distinct colors for clear differentiation and easy data interpretation.
Related Products
-

Budget Diagram by Item – Visual Representation of Budget Planning
#Financial Plans and Performance #Diagram #Capital Requirements
-

Item-by-item Budget Diagram – Enhance Efficiency in Financial Planning
#Financial Plans and Performance #Diagram #Capital Requirements
-

Tree Market Industry Trends – Growth and Opportunities
#Market and Competitor Analysis #Financial Plans and Performance #Graph
-

Mountain Climbing Table for Financial Planning and Performance
#Financial Plans and Performance #Diagram #Capital Requirements
