Mountain Climbing Table for Financial Planning and Performance
RJ0600090_20
- Last Update 07/14/2025
- File Size 21MB
- # of Slides 2
- File Format PPTX
- Slide Ratio 16:9
- Color
Keywords
- #Content-Based Slides
- #Design-Based Slides
- #Financial Plans and Performance
- #Diagram
- #Capital Requirements
- #Budget
- #Table
- #16:9
- #financial data table PowerPoint slide
- #financial comparison table presentation
- #budget analysis slide
- #how to create financial tables in PowerPoint
- #year-over-year financial data slide
About the Product
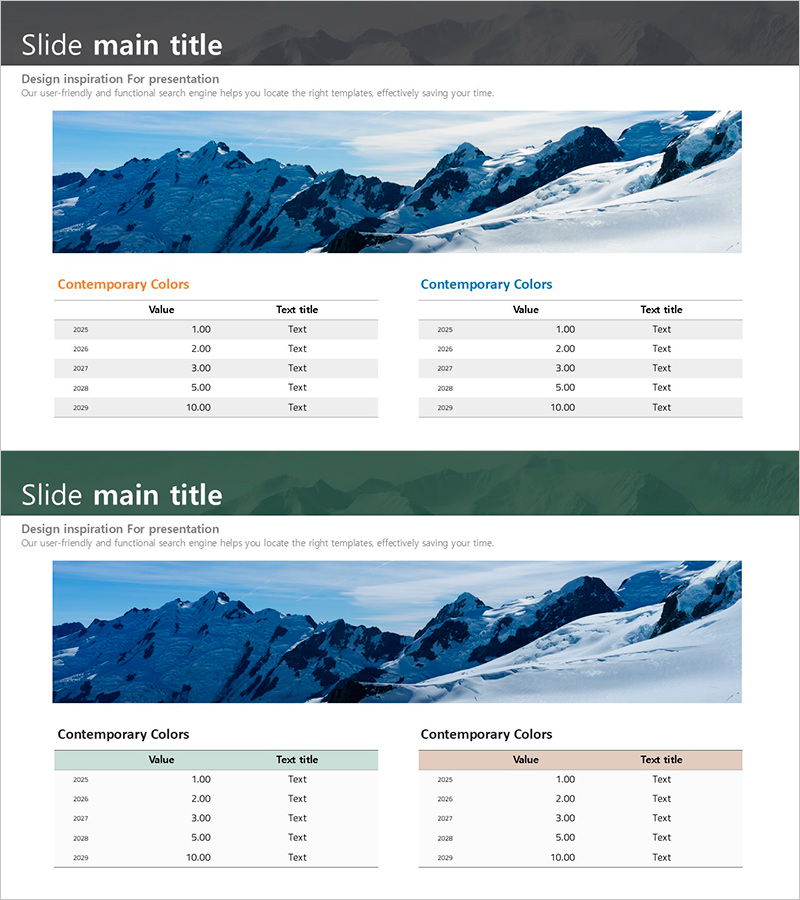
A 2-slide PowerPoint presentation set that visualizes financial planning and performance metrics with clarity and impact. Featuring a mountain landscape background as visual inspiration, the slides display a two-column table structure that enables direct comparison of annual financial data. The left table features an orange header while the right table uses a blue header, allowing simultaneous analysis of two different financial indicators. Each table includes Value and Text title columns with data entry fields for five fiscal years (2025–2029). The slides are ready for immediate use in presentations and fully editable for customization of colors, data, and layout.
Usage Points
-
Main Usage
This slide presents financial metrics, budget status, and performance figures in year-over-year comparison format to support data-driven decision-making. The dual-table structure accommodates independent financial items (such as projected vs. actual results or departmental budget comparisons), making it ideal for financial analysis presentations and investor communications.
-
How to Use
Use this slide in investor relations materials, business reports, and financial briefings to explain annual performance trends. Simply enter numerical values in the Value column and corresponding labels in the Text title column. The background image and table colors can be adjusted to match your corporate branding.
-
Recommended For
CFOs, financial managers, investor relations specialists, and executives presenting financial results benefit from this slide template. It is particularly effective for annual earnings presentations, quarterly financial briefings, investor meetings, and internal management reviews requiring data-backed analysis.
-
Slide Structure
Each slide features a title area at the top, a landscape image in the center, and two independent data tables at the bottom. The left table displays an orange header while the right table uses a blue header for visual distinction. Both tables include five rows of data entry fields corresponding to fiscal years 2025 through 2029.
Related Products
-

Overseas Traveler Analysis Chart – Suitable for Budget Planning
#Financial Plans and Performance #Diagram #Capital Requirements
-

Blue Line Wide Template Table2 – Stylish Design for Financial Planning
#Financial Plans and Performance #Diagram #Capital Requirements
-

Estimated Budget Breakdown – Financial Planning and Budget Management
#Financial Plans and Performance #Diagram #Capital Requirements
-

Ticket Illustration Table – Visualizing Budget Planning
#Financial Plans and Performance #Diagram #Capital Requirements
