Budget Diagram by Item – Visual Representation of Budget Planning
RJ0900029_24
- Last Update 08/25/2025
- File Size 0.9MB
- # of Slides 2
- File Format PPTX
- Slide Ratio 16:9
- Color
Keywords
- #Content-Based Slides
- #Design-Based Slides
- #Financial Plans and Performance
- #Diagram
- #Capital Requirements
- #Budget
- #Cluster
- #Combination Diagram
- #Closed Cluster Diagram
- #16:9
- #budget diagram PowerPoint
- #financial planning slide template
- #cluster diagram
- #budget allocation visualization
- #budget management presentation
About the Product
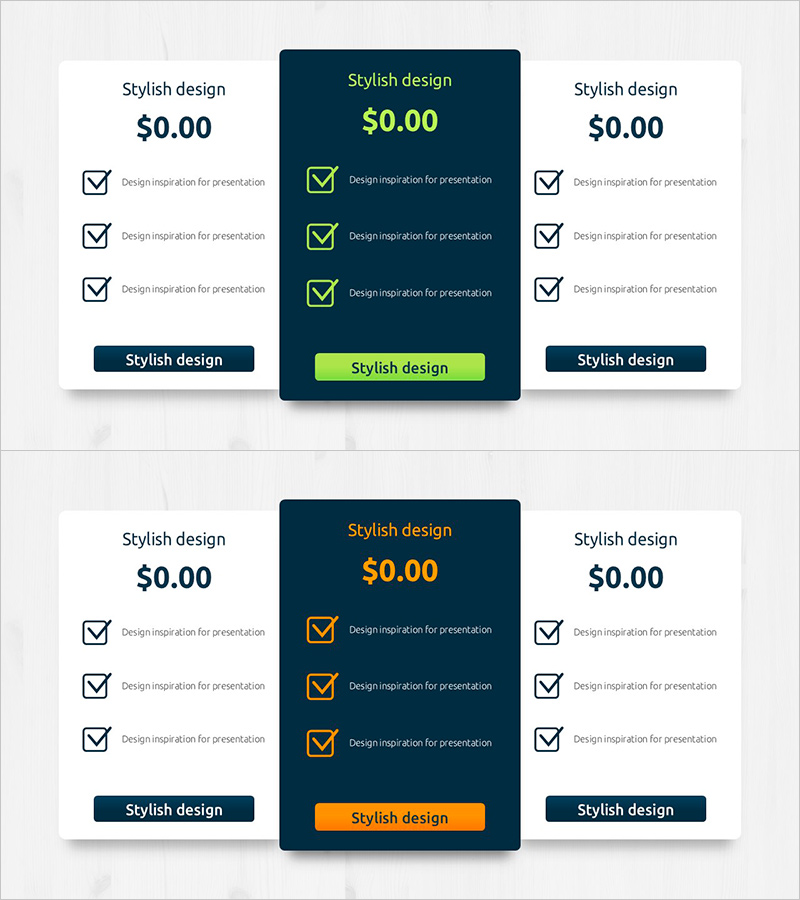
A nested cluster diagram PowerPoint slide designed for budget planning and financial analysis. This 2-slide presentation features a dark blue background with lime green accent colors, visually representing four budget items and their interrelationships. The diagram enables stakeholders to understand budget allocation and financial priorities at a glance. Ideal for financial reports, budget planning meetings, executive presentations, and investor briefings. The 16:9 widescreen PPTX format allows immediate editing and full customization of colors, text, and data values.
Usage Points
-
Main Usage
Visualize corporate budget allocation, financial planning, and departmental budget distribution to clearly communicate budget structure and priorities to executives and stakeholders.
-
How to Use
Use in financial reports (budget status section), quarterly budget planning meetings, executive presentations, investor relations briefings, and strategic planning sessions to display budget items and their relative importance.
-
Recommended For
CFOs, financial managers, business planning teams, department heads, and project managers responsible for budget planning and financial analysis. Particularly effective when explaining complex budget structures in a simple, intuitive manner.
-
Slide Structure
2-slide set featuring nested cluster nodes with four budget items per slide. Dark blue background with lime green accent borders and checkmark icons distinguish each item. Clear text input areas enable easy customization and data entry.
Related Products
-

Modern Graph Slide Template for Data Visualization
#Financial Plans and Performance #Diagram #Graph
-

Item-by-item Budget Diagram – Enhance Efficiency in Financial Planning
#Financial Plans and Performance #Diagram #Capital Requirements
-

Overseas Traveler Analysis Chart – Suitable for Budget Planning
#Financial Plans and Performance #Diagram #Capital Requirements
-

Business Goals Slide with Lights Background – Vision and Strategy Presentation
#Business Vision and Strategy #Diagram #Business Goals
