Tree Market Industry Trends – Growth and Opportunities
RJ0600099_20
- Last Update 07/18/2025
- File Size 0.9MB
- # of Slides 2
- File Format PPTX
- Slide Ratio 16:9
- Color
Keywords
- #Content-Based Slides
- #Design-Based Slides
- #Market and Competitor Analysis
- #Financial Plans and Performance
- #Graph
- #Industry Trends
- #Budget
- #Tax Strategy and Benefits
- #Column
- #Segmented Column
- #16:9
- #vertical bar chart PowerPoint
- #industry trends presentation
- #market analysis slide
- #4-year trend graph
- #data comparison chart
- #bar graph PowerPoint slide
About the Product
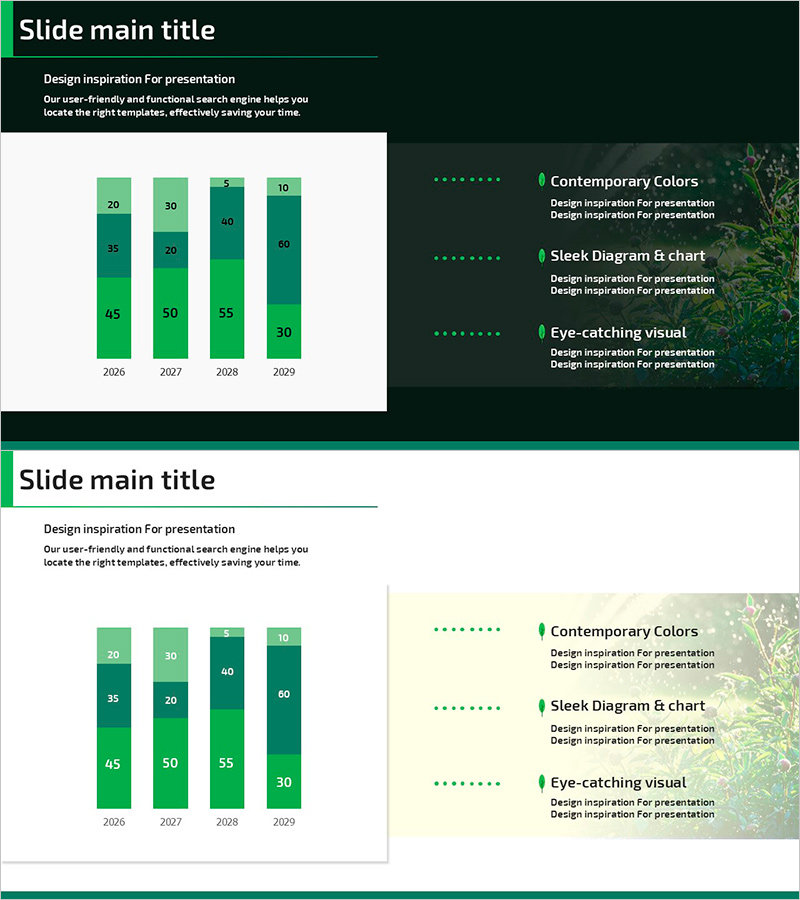
A vertical bar chart PowerPoint slide visualizing tree market industry trends across four years (2026–2029) with four data series. Each year displays segmented values in a green gradient color scheme, enabling clear year-over-year and series-by-series comparison. The balanced layout combines a left-side chart with a right-side text area, making it immediately applicable to presentations and reports. Delivered in 16:9 widescreen format with 2 slides, this template is ideal for market analysis, performance reporting, and strategic planning phases.
Usage Points
-
Main Usage
Visualizes year-over-year and series-by-series numerical comparisons to clearly communicate market growth trends and industry dynamics. The four-series vertical bars enable stakeholders to grasp complex data at a glance, delivering persuasive data representation for executive briefings, investor presentations, and strategic meetings.
-
How to Use
Input actual data into the left chart area and the graph updates automatically; add key insights and interpretations in the right text box. Customize colors and values to match your specific industry, market analysis, or tree market presentation while maintaining the professional two-column layout.
-
Recommended For
Industry analysts, marketing planners, finance professionals, and executives presenting market growth rates, sales trends, and market share changes. Effective for quarterly and annual performance reports, competitive analysis comparisons, and return-on-investment explanations.
-
Slide Structure
Two-slide set: the first features a dark background with a 4-series vertical bar chart (2026–2029, four bars per year) and a right-side text area (Contemporary Colors, Sleek Diagram & chart, Eye-catching visual – three items). The second slide provides the same structure with a light background variant for flexible presentation scenarios.
Related Products
-

Modern Graph Slide Template for Data Visualization
#Financial Plans and Performance #Diagram #Graph
-

Four-Year Industrial Market Trends – Market Analysis and Decisions
#Market and Competitor Analysis #Financial Plans and Performance #Graph
-

Sophisticated Vertical Bar Chart – Market Trend Analysis
#Market and Competitor Analysis #Graph #Industry Trends
-

Real Estate Market Trends Chart – Data Analysis and Performance
#Business Strategy #Market and Competitor Analysis #Graph
