Data Trend Analysis with Line Chart – Professional Insight and Visual Inspiration
RJ0600093_15
- Last Update 07/15/2025
- File Size 0.2MB
- # of Slides 2
- File Format PPTX
- Slide Ratio 16:9
- Color
Keywords
- #Content-Based Slides
- #Design-Based Slides
- #Business Strategy
- #Marketing Plan and Strategy
- #Diagram
- #Graph
- #Achievements
- #Distribution Strategy
- #Cluster
- #Line
- #Closed Cluster Diagram
- #Line Chart
- #16:9
- #line chart PowerPoint slide
- #multi-series trend analysis
- #4-line data visualization
- #business chart template
- #how to create line graph in PowerPoint
About the Product
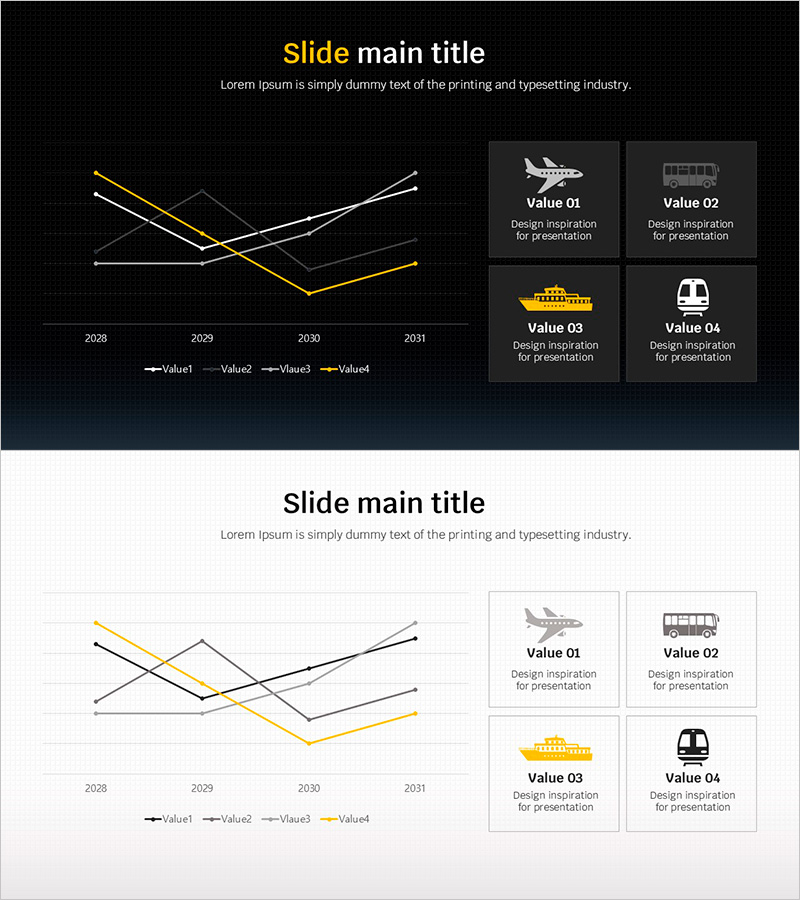
A multi-series line chart PowerPoint slide displaying four data trends across 2028–2031 with dark background, yellow accent line, and white/gray supporting lines. The right side features four icon boxes (airplane, bus, ship, train) representing each data series visually. This presentation template is optimized for business reports, performance analysis, and comparative trend visualization, ready for immediate use in executive presentations and analytical documents.
Usage Points
-
Main Usage
Visualize and compare multiple data series over time, highlighting trend patterns and growth trajectories across different categories or metrics. Ideal for displaying sales performance, customer metrics, market share, or operational KPIs simultaneously.
-
How to Use
Input your four data series values for each year (2028–2031) into the chart. Customize the icon boxes on the right to represent your categories (product lines, regions, departments). The dark background ensures high visibility in projection environments and professional presentation settings.
-
Recommended For
Finance professionals, marketing managers, business analysts, project leaders, and executives presenting quarterly results, market analysis, financial performance, consulting proposals, or strategic reviews requiring multi-metric comparison.
-
Slide Structure
Title area at top + left side: 4-series line chart (X-axis: 2028–2031, Y-axis: numeric scale, legend included) + right side: 2×2 icon grid (Value 01–04). Two-slide set with dark and light theme variants.
Related Products
-

Sewing Graph Chart – Market Status and Performance Analysis
#Business Strategy #Market and Competitor Analysis #Diagram
-

Market Analysis Broken Line Graph – Visualizing Business Performance
#Business Strategy #Market and Competitor Analysis #Graph
-

Illustration Bell Graph – Performance and Business Strategy
#Business Strategy #Other #Achievements
-

Oriental Pharmaceutical Materials Marketing Plan – Strategic Approach
#Marketing Plan and Strategy #Diagram #Marketing Objectives
