Key Performance Graphs – Business Strategy and Performance
RJ0600099_23
- Last Update 01/18/2025
- File Size 7.2MB
- # of Slides 2
- File Format PPTX
- Slide Ratio 16:9
- Color
Keywords
About the Product
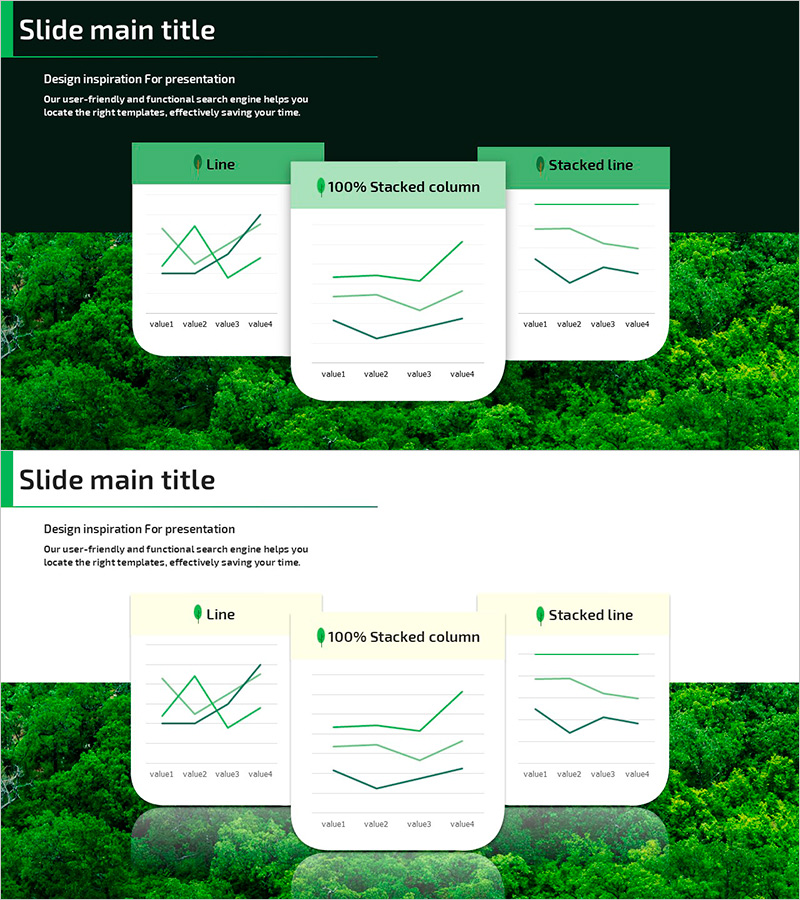
Visualize business performance and key metrics with this line chart PowerPoint slide template. The set includes three data visualization methods: line chart, 100% stacked column, and stacked line, enabling diverse trend comparisons in business presentations. Consistent green color scheme and clear axis labels make it immediately applicable to financial reports, KPI analysis, and business strategy results. The 16:9 widescreen format with 2-slide composition integrates seamlessly into presentation flows.
Usage Points
-
Main Usage
Express numerical changes over time such as business results, sales trends, and KPI performance through line charts to intuitively convey growth rates, decline trends, and comparative analysis. Emphasize critical data in financial reports, business performance presentations, and strategy result analysis slides.
-
How to Use
Use line chart for single or multi-series trend expression, 100% stacked column for composition ratio changes, and stacked line for cumulative trend analysis. Replace axis labels (value1-4) with actual data and modify legends for immediate presentation use.
-
Recommended For
Recommended for CFO and finance team quarterly performance presentations, marketing team campaign result analysis, sales team target achievement reports, and executive strategy evaluation presentations. Suitable for business plans, investor pitch decks, and performance reports requiring data-driven decision-making.
-
Slide Structure
Slide 1: Line chart with 4 data points supporting single or multi-series representation / Slide 2: 100% stacked column (4-item composition ratio) and stacked line (4-point cumulative trend) in parallel layout. Green header bar and white background maximize data readability.
Related Products
-

Geometric Pattern Wide PowerPoint Line Chart – Business Performance Analysis
#Business Strategy #Financial Plans and Performance #Graph
-

Kids Drawing Line Graph – Emphasizing Performance
#Business Strategy #Financial Plans and Performance #Graph
-

Highlighting Key Data Points in Trends – Performance and Vision
#Business Strategy #Financial Plans and Performance #Graph
-

Performance Analysis Visualization with Line Graph – Challenge and Success
#Business Strategy #Financial Plans and Performance #Graph
