American Football Match Performance Status – Highlighting Competitive Advantage
RJ0800015_10
- Last Update 08/04/2025
- File Size 1.4MB
- # of Slides 2
- File Format PPTX
- Slide Ratio 16:9
- Color
Keywords
- #Content-Based Slides
- #Design-Based Slides
- #Business Strategy
- #Market and Competitor Analysis
- #Graph
- #Achievements
- #Competitive Advantage
- #Line
- #Line Chart
- #16:9
- #line chart PowerPoint slide
- #multi-series trend comparison
- #performance analysis chart
- #competitive advantage graph
- #data visualization template
About the Product
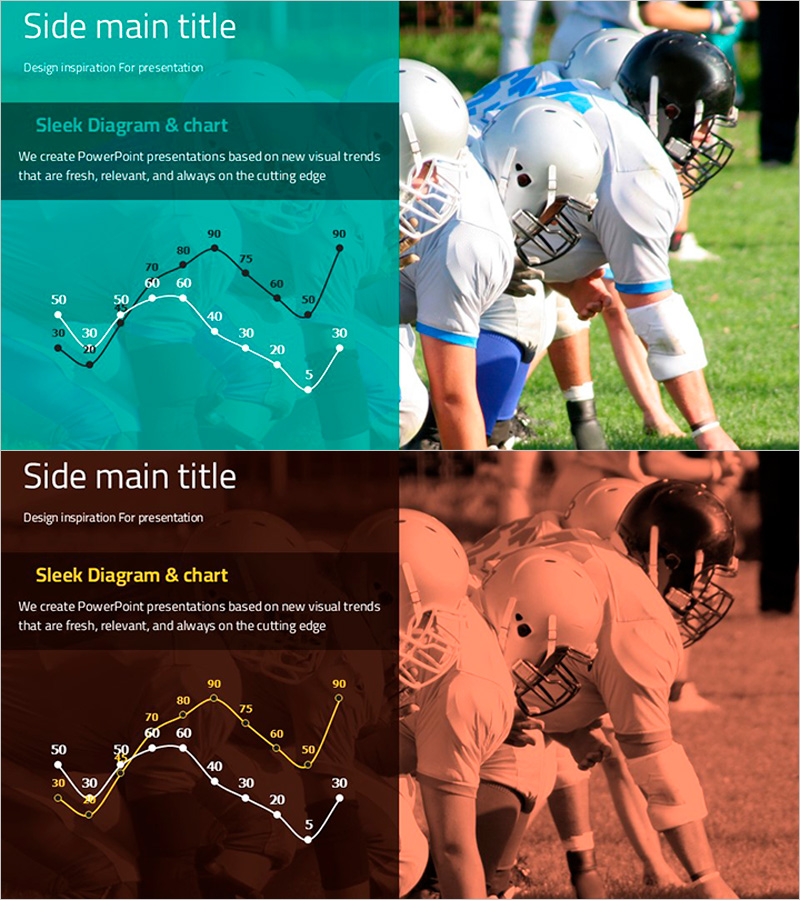
A professional line chart PowerPoint slide designed for sports performance analysis, market trends, and competitive advantage visualization. Features dual-series data representation on turquoise and brown background layouts, with numeric labels at each data point for precise performance reporting. Optimized for 16:9 widescreen format with 2-slide configuration, ready for immediate use in presentations, reports, and analytical materials.
Usage Points
-
Main Usage
Visualizes multi-series data trends such as sports performance metrics, sales progression, market share evolution, and competitive benchmarking. Numeric labels at each data point enable clear quantitative performance assessment and trend identification across multiple data streams.
-
How to Use
Deploy the turquoise-background slide for primary trend analysis and the brown-background slide for comparative analysis to create visual contrast. Edit data points and labels with actual figures, and customize series colors to align with corporate branding guidelines as needed.
-
Recommended For
Recommended for sports management executives, marketing analysts, sales teams, and business intelligence professionals. Particularly effective for quarterly performance reviews, competitive benchmarking presentations, market trend analysis, and investor relations materials.
-
Slide Structure
2-slide set featuring dual-series line charts on each slide. Each chart displays 10 horizontal intervals with 0-90 numeric range on vertical axis. Turquoise background (top slide) and brown background (bottom slide) provide visual differentiation and contrast effect.
Related Products
-

Graph for Economic Growth and Competitive Advantage Visualization
#Business Strategy #Market and Competitor Analysis #Graph
-

Red Black Curved Line Trend – Market Analysis and Competitive Advantage
#Business Strategy #Market and Competitor Analysis #Graph
-

Visualizing Business Strategy with Round Line Chart – Emphasizing Market Analysis and Performance
#Business Strategy #Market and Competitor Analysis #Graph
-

Trends in the Number of Professional Tennis Spectators – Performance and Competitive Advantage
#Business Strategy #Market and Competitor Analysis #Graph
