Conservation Donut Chart – Visualization of Sustainability
RJ0600088_6
- Last Update 07/14/2025
- File Size 0.3MB
- # of Slides 2
- File Format PPTX
- Slide Ratio 16:9
- Color
Keywords
- #Content-Based Slides
- #Design-Based Slides
- #Company Introduction
- #Market and Competitor Analysis
- #Diagram
- #Graph
- #Key Achievements
- #Market Share
- #Cluster
- #Circles
- #Closed Cluster Diagram
- #Doughnut Chart
- #16:9
- #donut chart PowerPoint
- #pie chart template
- #CSR performance slide
- #sustainability visualization
- #ratio comparison presentation
- #donut graph slide design
About the Product
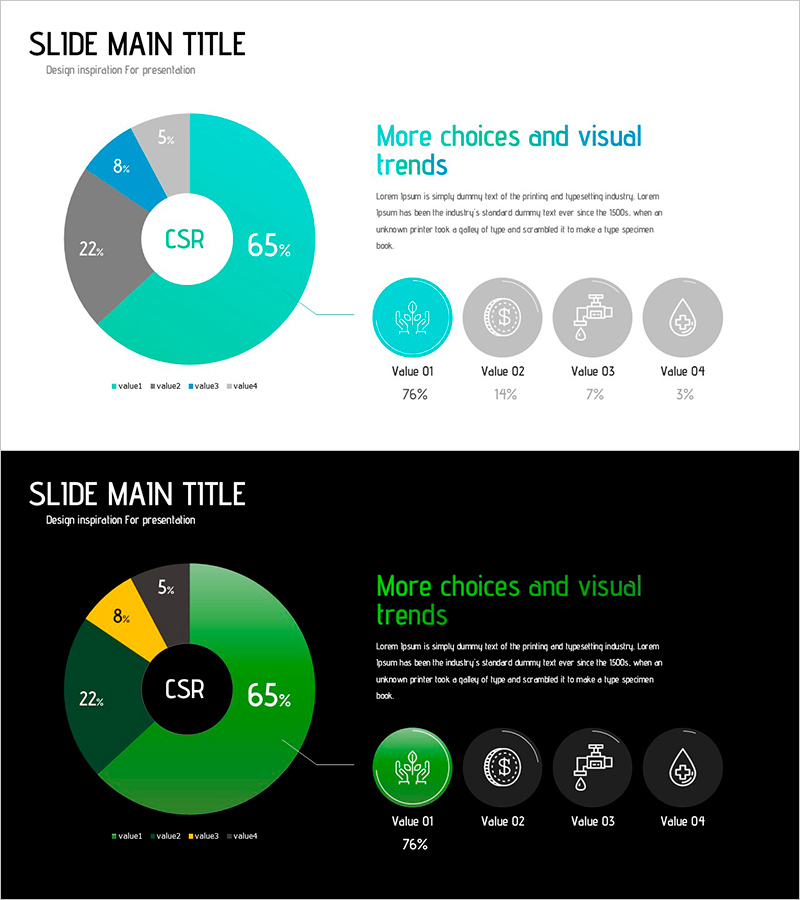
A donut chart PowerPoint slide designed to showcase corporate CSR performance and sustainability metrics at a glance. The center features a white circular area for key messaging, surrounded by four color-coded segments representing different CSR dimensions. The design uses cyan, blue, gray, and yellow to distinguish each category, with accompanying icons and percentage data on the right side for enhanced information clarity. This slide template is optimized for comparing sustainability initiatives, environmental impact, social contribution, and economic value across multiple dimensions. Two versions are included—light background and dark background—allowing you to select the best fit for your presentation environment.
Usage Points
-
Main Usage
Visualize corporate CSR achievements, environmental performance, and sustainability indicators using a ratio-based donut chart. The center circle emphasizes core messaging while surrounding segments break down detailed categories, creating clear information hierarchy for stakeholder communication.
-
How to Use
Integrate into annual reports, sustainability reports, investor presentations, and corporate overview decks within the performance analysis section. Edit segment colors and percentages with your own data for immediate use. Choose between light or dark background versions based on your presentation venue lighting and screen setup.
-
Recommended For
Corporate executives, sustainability officers, marketing and communications teams, investor relations (IR) professionals, environmental policy officials, and CSR project leaders presenting performance metrics and stakeholder updates.
-
Slide Structure
Center white circular area containing 'CSR' label, surrounded by four donut segments (65%, 22%, 8%, 5%). Right side displays four category icons (hand, coin, building, water droplet) with labels and corresponding percentages (76%, 14%, 7%, 3%). Two versions provided: light background and dark background.
Related Products
-

Market Share Donut Pie Chart – Visualization of Data Analysis
#Company Introduction #Market and Competitor Analysis #Diagram
-

Market Share by Instrument Visualization – Donut Chart for Market Analysis
#Market and Competitor Analysis #Diagram #Graph
-

Visualization of Traditional Items Proportion – Market Share Analysis
#Company Introduction #Market and Competitor Analysis #Graph
-

Trend Color Donut Chart Slide Template – Market and Competitive Analysis
#Company Introduction #Market and Competitor Analysis #Graph
