Blue Line Wide Template Donut Chart – Performance Analysis
RJ0200066_7
- Last Update 04/18/2025
- File Size 0.2MB
- # of Slides 2
- File Format PPTX
- Slide Ratio 16:9
- Color
Keywords
- #Content-Based Slides
- #Design-Based Slides
- #Company Introduction
- #Market and Competitor Analysis
- #Graph
- #Key Achievements
- #Market Share
- #Circles
- #Doughnut Chart
- #16:9
- #donut chart PowerPoint slide
- #pie chart template
- #performance analysis presentation
- #market share visualization
- #data ratio slide
- #how to create donut chart in PowerPoint
About the Product
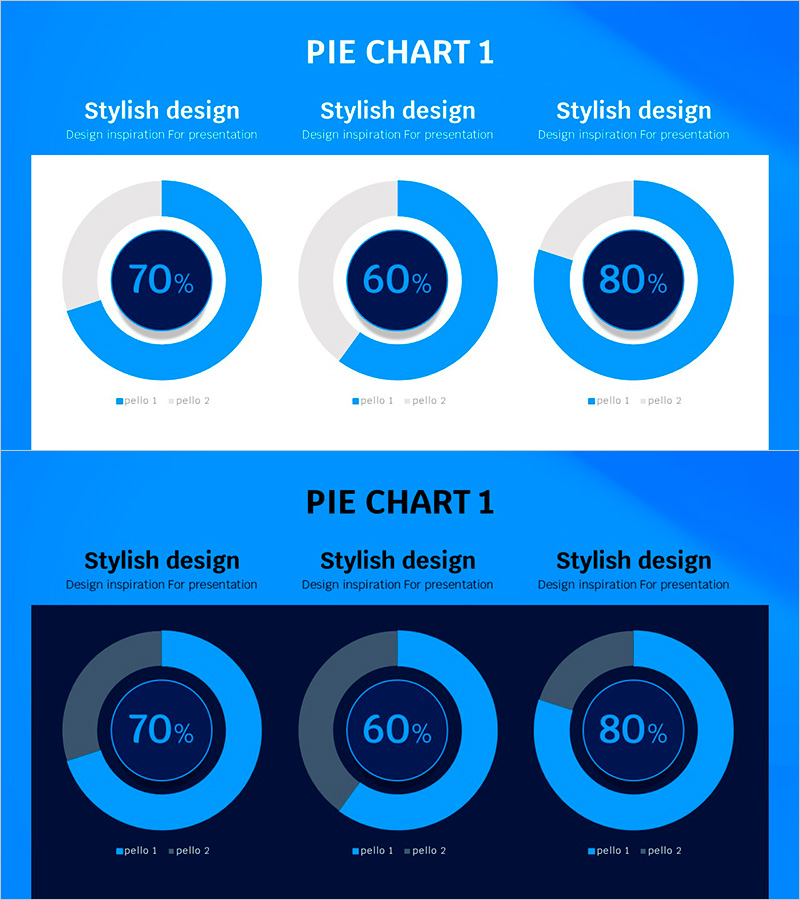
A professional donut chart slide template for PowerPoint presentations that visualizes performance metrics and market share analysis. The design features a two-color combination of bright blue and gray tones, with percentage values prominently displayed in the center of each donut. The 2-slide set showcases different data distributions (70%, 60%, 80%) and is ready for immediate use in business reports and presentations. Optimized for 16:9 widescreen format, this template integrates seamlessly into modern presentation workflows.
Usage Points
-
Main Usage
Designed to visualize the relationship between parts and whole, such as performance metrics, market share distribution, and composition ratios. The donut structure emphasizes the central key figure while clearly displaying each segment's proportion. Ideal for executive reports, quarterly performance presentations, and marketing analysis materials.
-
How to Use
Input your actual data into each donut chart and update the percentage values accordingly. Replace the legend labels (pello 1, pello 2) with your category names and adjust colors if needed. Add descriptive text to supplement the analysis and create a compelling presentation.
-
Recommended For
Finance professionals, marketing teams, business analysts, management consultants, and data specialists who need to present numerical performance data visually. Suitable for quarterly earnings reports, market research presentations, divisional performance reviews, and strategic business communications.
-
Slide Structure
Two-slide set featuring light background (top) and dark background (bottom) versions. Each slide displays three donut charts in horizontal layout, with each chart divided into two segments (blue and gray) and a centered percentage value. Includes title and legend areas for easy data entry and immediate presentation use.
Related Products
-

Red Sky Donut Chart – Market Share Analysis
#Company Introduction #Market and Competitor Analysis #Graph
-

Rainbow Presentation Template Doughnut Chart – Start Your Unique Analysis
#Company Introduction #Market and Competitor Analysis #Graph
-

Communication Marketing Donut Chart – Performance Visualization
#Company Introduction #Market and Competitor Analysis #Graph
-

Trend Color Donut Chart Slide Template – Market and Competitive Analysis
#Company Introduction #Market and Competitor Analysis #Graph
