Donut Charts of Animals and Plants – Effective Market Analysis Tool
RJ0600084_9
- Last Update 07/13/2025
- File Size 0.5MB
- # of Slides 2
- File Format PPTX
- Slide Ratio 16:9
- Color
Keywords
- #Content-Based Slides
- #Design-Based Slides
- #Business Strategy
- #Market and Competitor Analysis
- #Diagram
- #Graph
- #Achievements
- #Market Share
- #Cluster
- #Circles
- #Closed Cluster Diagram
- #Doughnut Chart
- #16:9
- #donut chart PowerPoint
- #pie chart slide template
- #ratio analysis presentation
- #4-segment donut diagram
- #market analysis PowerPoint slide
About the Product
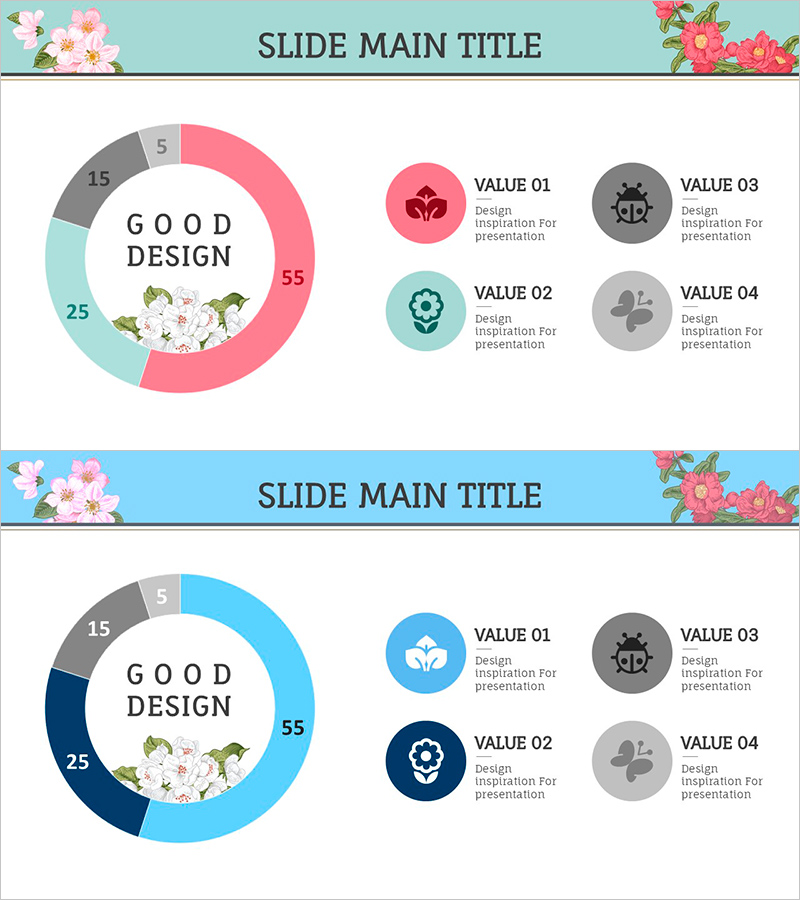
A 2-slide PowerPoint donut chart template featuring animals and plants illustrations with a 4-segment data visualization design. The soft color palette of pink, light blue, and gray tones is ideal for market analysis presentations, performance reports, and business strategy discussions. The central circular area accommodates key messages or summary data, while the right side displays four icon-based legend items for clear data interpretation. Coordinated floral header decoration maintains visual consistency throughout your presentation, and the fully editable PPTX format allows quick customization of all text and data values.
Usage Points
-
Main Usage
Visualizes four-category ratio data such as market share, sales distribution, customer demographics, or budget allocation. The donut center provides space for summary metrics or core messages, enabling viewers to grasp the complete context at a glance.
-
How to Use
Replace the segment percentages and labels with your actual data values. Update the four legend items on the right side to match your categories. Colors can remain as designed or be adjusted to match your corporate brand palette. The floral header decoration can be retained or removed based on presentation style preference.
-
Recommended For
Marketing professionals presenting market analysis reports, sales teams showcasing performance metrics, executives explaining business strategies, and educators analyzing student demographics. The soft color scheme and nature-themed illustrations create a friendly and trustworthy presentation atmosphere.
-
Slide Structure
Both slides feature identical layout: light blue header bar with floral illustrations at top, 4-segment donut chart positioned left-center (pink 55%, light blue 25%, gray 15%, gray 5%), and four circular icon legend items on the right in coordinated colors. 16:9 widescreen format optimized for modern projectors and online presentations.
Related Products
-

Big Data Development Status Analysis Graph – Conveying Market Share
#Product/Service Introduction #Market and Competitor Analysis #Diagram
-

Donut Chart Slide for Market & Competitive Analysis – Korea's Representative Image Survey
#Business Strategy #Market and Competitor Analysis #Graph
-

Application Development Status Visualized with Doughnut Diagram
#Product/Service Introduction #Market and Competitor Analysis #Diagram
-

Market Share Analysis Graph by Technology – Competition and Collaboration
#Market and Competitor Analysis #Diagram #Graph
