Holiday Donut Charts – Business Strategy and Performance Analysis
RJ0600106_6
- Last Update 07/19/2025
- File Size 2.3MB
- # of Slides 2
- File Format PPTX
- Slide Ratio 16:9
- Color
Keywords
- #Content-Based Slides
- #Design-Based Slides
- #Business Strategy
- #Market and Competitor Analysis
- #Graph
- #Achievements
- #Market Share
- #Circles
- #Doughnut Chart
- #16:9
- #donut chart PowerPoint slide
- #pie chart presentation template
- #ratio analysis slide
- #data visualization PPT
- #business performance chart
- #how to create donut chart in PowerPoint
About the Product
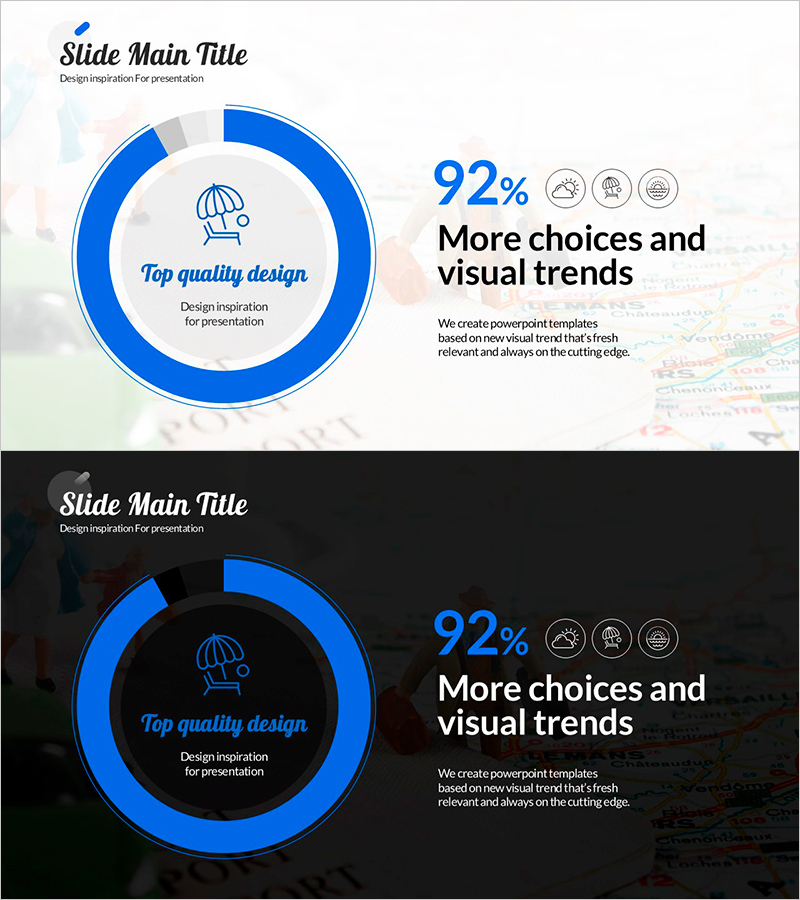
A professional donut chart PowerPoint slide set featuring two layouts for visualizing business performance and market share data. The design includes a bright background version and a dark background version, each with a central percentage display (92%) surrounded by three icon indicators. The blue donut ring and gray background elements clearly represent data proportions, making it ideal for performance reports, strategic analysis presentations, and business dashboards. Provided in 16:9 widescreen PPTX format, fully editable in all PowerPoint versions.
Usage Points
-
Main Usage
Visualize business performance metrics, market share distribution, customer satisfaction scores, budget allocation, sales composition, and other ratio-based data. The center-focused percentage display emphasizes key performance indicators while the donut ring shows proportional breakdown.
-
How to Use
Insert into performance analysis sections of business reports, quarterly results presentations, annual reviews, and strategic planning decks. Replace the donut ring color and center percentage with your actual data, then add descriptive text in the right panel. Choose between light or dark background version based on your presentation environment.
-
Recommended For
Marketing managers, financial analysts, business planners, management consultants, and executives preparing data-driven reports. Ideal for quarterly performance reviews, ROI analysis, customer segmentation reports, and stakeholder communications requiring ratio-based visual representation.
-
Slide Structure
Slide 1 (light background): Left side features one blue donut ring with 92% center value and three surrounding icons; right side contains title and description text area. Slide 2 (dark background): Identical layout with black background and white text. Both slides use 16:9 widescreen aspect ratio.
Related Products
-

Market Share Analysis with Donut Chart and Box Icon
#Business Strategy #Market and Competitor Analysis #Graph
-

Diagram Slide for Vehicle Brakes and Seats Explanation
#Business Strategy #Market and Competitor Analysis #Diagram
-

Donut Chart for Forest Preservation Rate – Strategy for Environmental Sustainability
#Business Strategy #Market and Competitor Analysis #Graph
-

Donut Chart Slide for Market & Competitive Analysis – Korea's Representative Image Survey
#Business Strategy #Market and Competitor Analysis #Graph
