Market Share Analysis with Donut Chart and Box Icon
RJ0500035_12
- Last Update 06/16/2025
- File Size 0.3MB
- # of Slides 2
- File Format PPTX
- Slide Ratio 16:9
- Color
Keywords
- #Content-Based Slides
- #Design-Based Slides
- #Business Strategy
- #Market and Competitor Analysis
- #Graph
- #Achievements
- #Market Share
- #Circles
- #Doughnut Chart
- #16:9
- #donut chart PowerPoint
- #pie chart slide template
- #market share analysis presentation
- #data visualization PPT
- #competitive analysis slide
- #ratio chart download
About the Product
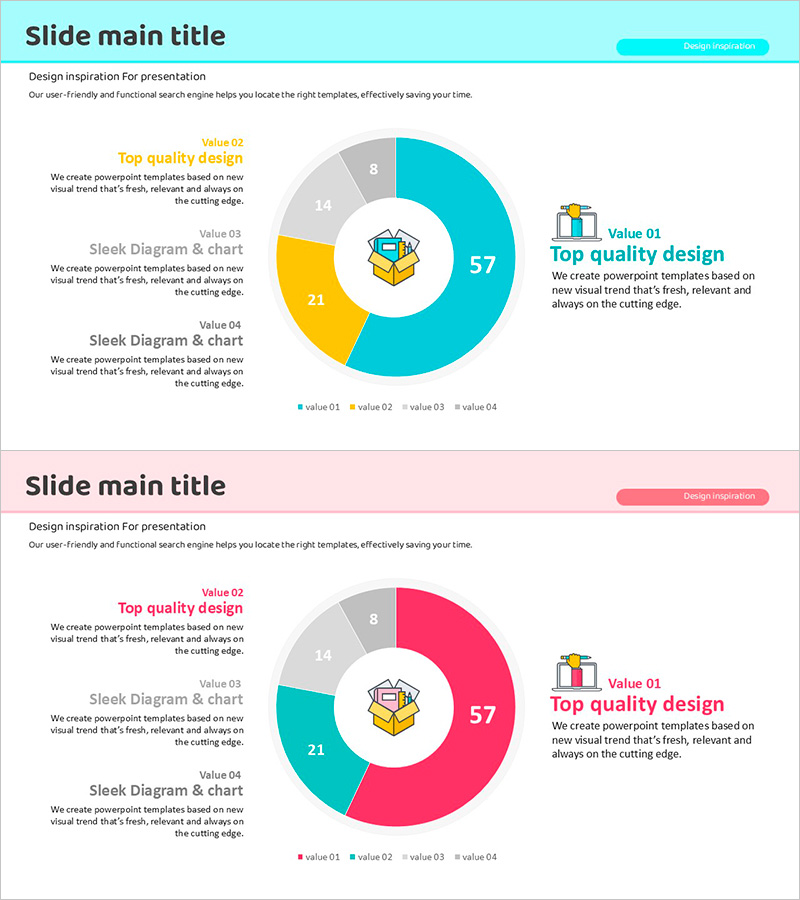
A donut chart PowerPoint slide designed for market share and competitive analysis presentations. The 4-segment pie chart features a central icon placement with cyan, yellow, and gray color segments for clear data differentiation. Two slides with identical layouts enable comparison of multiple datasets, making this presentation template ideal for business strategy reports, performance analysis, and competitive landscape reviews.
Usage Points
-
Main Usage
Visualize proportional data such as market share, sales distribution, customer composition, and budget allocation. The central icon area emphasizes key messages or brand logos, increasing slide impact in executive presentations.
-
How to Use
Apply in executive briefings, business planning presentations, marketing strategy meetings, and quarterly performance reviews. Edit segment values and labels with actual data, and adjust colors to match brand identity guidelines.
-
Recommended For
Recommended for executives, planning teams, marketing departments, sales teams, and finance teams requiring data-driven decision-making. Particularly effective for quarterly/annual performance reports, market analysis, competitor comparison, and budget status presentations.
-
Slide Structure
Two-slide set with identical layouts featuring a 4-segment donut chart (Value 01–04), central icon area, and left-side text section. Three primary colors (cyan, yellow, gray) distinguish data series. Optimized for 16:9 widescreen format with full editing capability.
Related Products
-

Blue Green Progress Visualization – Graph for Achievement Rate
#Product/Service Introduction #Business Strategy #Market and Competitor Analysis
-

Donut Charts of Animals and Plants – Effective Market Analysis Tool
#Business Strategy #Market and Competitor Analysis #Diagram
-

Donut Chart and Mobile Mockup – Market Share Analysis
#Business Strategy #Market and Competitor Analysis #Graph
-

Diagram Slide for Vehicle Brakes and Seats Explanation
#Business Strategy #Market and Competitor Analysis #Diagram
