Market Share Analysis Graph by Technology – Competition and Collaboration
RM0100006_11
- Last Update 01/26/2025
- File Size 0.3MB
- # of Slides 2
- File Format PPTX
- Slide Ratio 16:9
- Color
Keywords
- #Content-Based Slides
- #Design-Based Slides
- #Market and Competitor Analysis
- #Diagram
- #Graph
- #Market Status
- #Market Share
- #Cluster
- #Circles
- #Closed Cluster Diagram
- #Doughnut Chart
- #16:9
- #donut chart PowerPoint slide
- #pie chart template download
- #market share analysis PPT
- #3-segment donut diagram
- #how to create donut chart in PowerPoint
About the Product
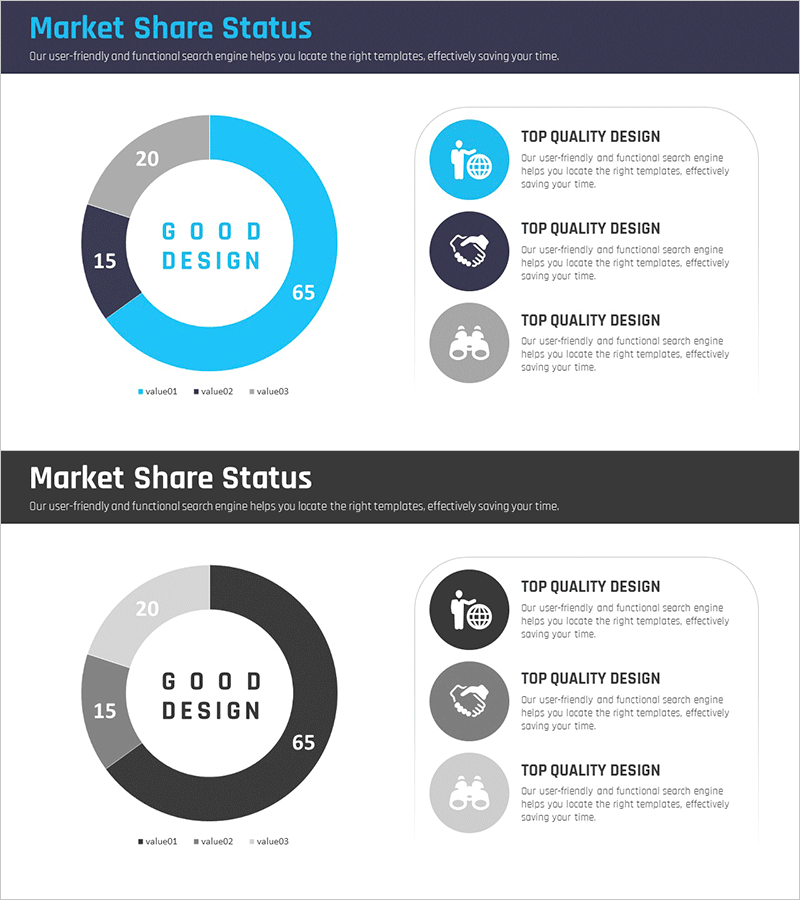
A donut chart PowerPoint slide that visualizes market share status across three segments with clear color differentiation. The design features bright blue, dark gray, and black segments with a centered 'GOOD DESIGN' message, complemented by three icon-labeled information boxes on the right side. This slide template is ideal for presenting technology-based market analysis, competitive positioning, revenue composition, or customer segmentation in business reports and investor presentations.
Usage Points
-
Main Usage
Displays the proportional relationship between three market segments or data categories in a visually intuitive donut format. The centered design emphasizes key messaging while maintaining clear numerical comparison across segments. Ideal for technology-based analysis, competitive landscape, and customer composition presentations.
-
How to Use
Input your data values into the left donut chart segments and add category names and descriptions in the three right-side information boxes. Icons can be customized to match your content, and colors are fully editable to align with corporate branding. Ready to use in executive reports, investor pitches, and strategy presentations.
-
Recommended For
Executives, marketing teams, sales professionals, and strategic planners presenting market conditions, competitive analysis, or customer segmentation. Suitable for quarterly business reviews, new business proposals, competitive benchmarking, and customer strategy presentations.
-
Slide Structure
2-slide set in 16:9 widescreen format (PPTX). Slide 1: Light blue background with 3-segment donut chart (65, 20, 15 proportions), centered 'GOOD DESIGN' text, and three right-aligned icon callout boxes (globe, handshake, collaboration icons). Slide 2: Identical layout with dark background variation.
Related Products
-

Donut Chart Slide for Dessert Menu Research – Market Analysis
#Market and Competitor Analysis #Diagram #Graph
-

Distribution of Regulatory Components – Visualizing Market Conditions
#Market and Competitor Analysis #Graph #Market Status
-

Smoking Rates among Lung Cancer Patients – Market Analysis
#Market and Competitor Analysis #Graph #Market Status
-

Donut Chart Depicting Market Share – Status of Home Repair Support Projects
#Market and Competitor Analysis #Graph #Market Status
