Horizontal Bar Graph for Animal and Plant Market Trends
RJ0600084_13
- Last Update 07/13/2025
- File Size 2.1MB
- # of Slides 2
- File Format PPTX
- Slide Ratio 16:9
- Color
Keywords
- #Content-Based Slides
- #Design-Based Slides
- #Market and Competitor Analysis
- #Diagram
- #Graph
- #Competitor Analysis
- #Industry Trends
- #Cluster
- #Closed Cluster Diagram
- #16:9
- #horizontal bar chart PowerPoint
- #bar graph slide template
- #market trends analysis chart
- #year-over-year data comparison PPT
- #competitive analysis graph PowerPoint
About the Product
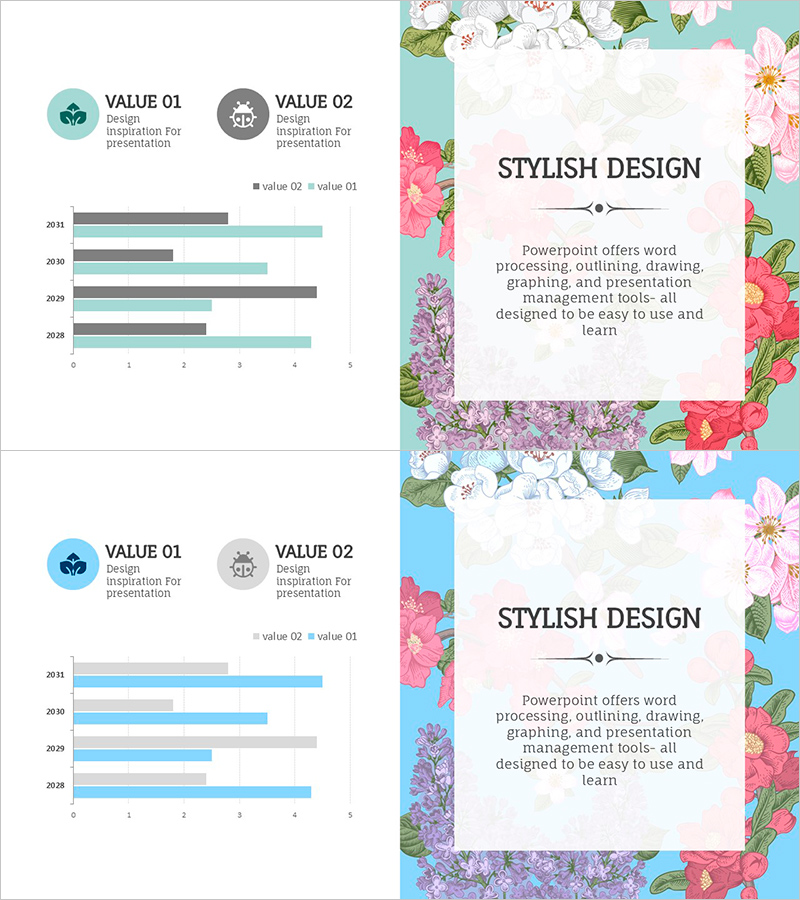
A horizontal bar chart PowerPoint slide designed to visualize animal and plant market trends across multiple years. This presentation template displays data from 2028 to 2031 in two series—VALUE 01 (teal) and VALUE 02 (gray)—enabling side-by-side comparison of market metrics. The bar lengths intuitively represent numerical differences, while icons and labels clearly distinguish each category. Ideal for competitive analysis, market share comparison, sales trend analysis, and other business intelligence presentations. Formatted in 16:9 widescreen with 2 slides ready for immediate editing and customization.
Usage Points
-
Main Usage
Visualize year-over-year market growth, competitive market share, and sales volume changes using dual-series horizontal bars. Teal and gray color contrast clearly differentiates the two data values, while bar length intuitively represents numerical magnitude for easy audience comprehension.
-
How to Use
Apply this slide in market analysis reports, business plans, and investor pitch decks within the market overview section. Simply input your data and adjust bar lengths and values for immediate presentation use. Particularly effective when emphasizing year-over-year trends or comparing performance across competitors.
-
Recommended For
Marketing professionals, business strategists, financial analysts, and consultants who rely on data-driven presentations. Especially valuable for industries related to animals and plants—agriculture, livestock, horticulture, biotechnology—when presenting market conditions and competitive positioning.
-
Slide Structure
Two slides with identical horizontal bar chart layouts. The Y-axis displays five years (2028–2031), while the X-axis shows a 0–5 numerical scale. Two data series—VALUE 01 (teal) and VALUE 02 (gray)—appear side-by-side for each year, facilitating direct comparison and trend analysis.
Related Products
-

Typographic Wide Template Line Chart – Effective Data Visualization for Market Analysis
#Market and Competitor Analysis #Diagram #Graph
-

Spaceship Launch Analysis Graph – Ideal for Competitor Analysis
#Market and Competitor Analysis #Diagram #Graph
-

Space Industry Segmentation Bar Graph – Essential for Market Analysis
#Market and Competitor Analysis #Diagram #Graph
-

Competitive Market Trend Analysis Graph – Visualizing Market Trends
#Market and Competitor Analysis #Graph #Competitor Analysis
