Competitive Market Trend Analysis Graph – Visualizing Market Trends
RM0400004_6
- Last Update 02/15/2025
- File Size 3.5MB
- # of Slides 2
- File Format PPTX
- Slide Ratio 16:9
- Color
Keywords
About the Product
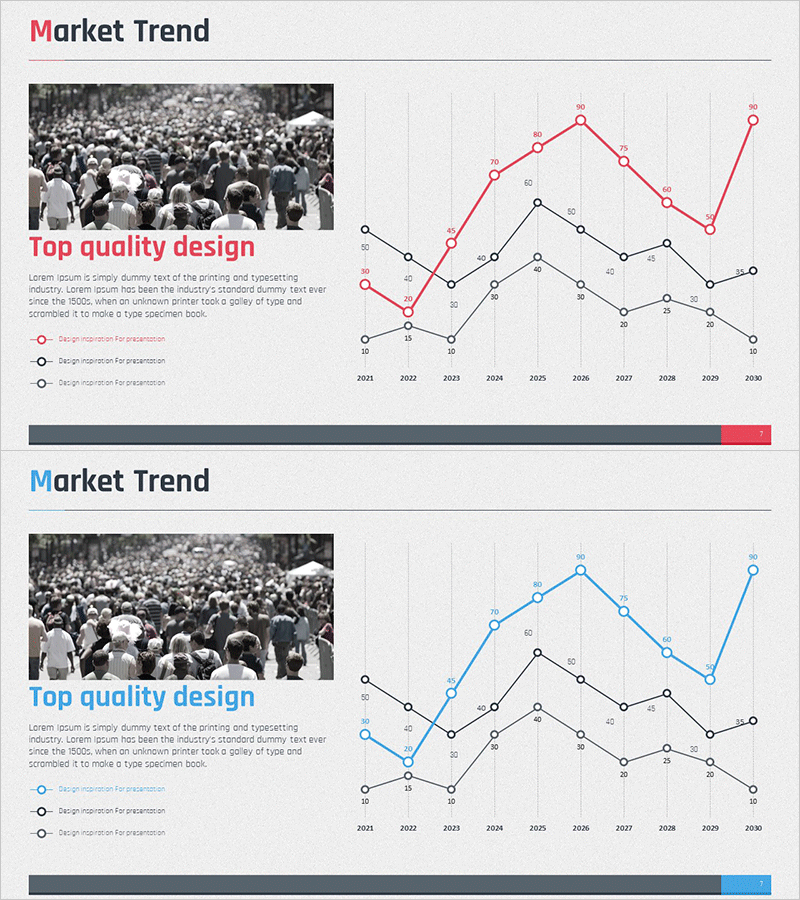
A line chart PowerPoint slide for visualizing competitive market trends over time. This presentation template displays 10 years of market data from 2021 to 2030 across three distinct data series, using red, black, and gray color coding for clear visual differentiation. The left side features descriptive text and a black-and-white photograph providing qualitative context, while the right side presents a grid-background line chart showing quantitative trends. Formatted in 16:9 widescreen ratio with 2 slides, this template is ready for immediate use in business reports, market analysis presentations, executive briefings, and strategic planning meetings.
Usage Points
-
Main Usage
Visualize long-term market trend changes using a multi-series line chart to support market analysis and executive decision-making. Compare three data series simultaneously to clearly communicate relative performance and market change patterns to stakeholders.
-
How to Use
Use this slide to represent numerical changes over time such as market analysis, competitor comparison, revenue trends, or customer satisfaction evolution. Replace the sample data with your actual figures, update the descriptive text on the left with analysis background and key insights, and customize colors to match your corporate brand if needed.
-
Recommended For
Marketing managers, executives, business development teams, financial analysts, and consultants presenting market status reports, strategic planning sessions, investor presentations, and quarterly business reviews. Particularly effective for explaining competitive benchmarking and market share evolution.
-
Slide Structure
The slide features a 2:1 left-right split layout. The left section contains title, descriptive text, and a black-and-white photograph area. The right section displays a line chart with a grid background, X-axis spanning 2021–2030, Y-axis ranging 0–90, three colored line series (red, black, gray), circular data point markers, legend, and data labels.
Related Products
-

Typographic Wide Template Line Chart – Effective Data Visualization for Market Analysis
#Market and Competitor Analysis #Diagram #Graph
-

Market Trend Line Comparison Analysis Chart
#Market and Competitor Analysis #Graph #Competitor Analysis
-

Competitor Analysis Broken Line Graph – Market Trends and Vision
#Market and Competitor Analysis #Graph #Competitor Analysis
-

Market Trend Analysis Broken Line Graph – Competitor Analysis
#Market and Competitor Analysis #Diagram #Graph
