Stacked Bar Graph for Planting
RJ0600083_8
- Last Update 07/13/2025
- File Size 1.1MB
- # of Slides 2
- File Format PPTX
- Slide Ratio 16:9
- Color
Keywords
About the Product
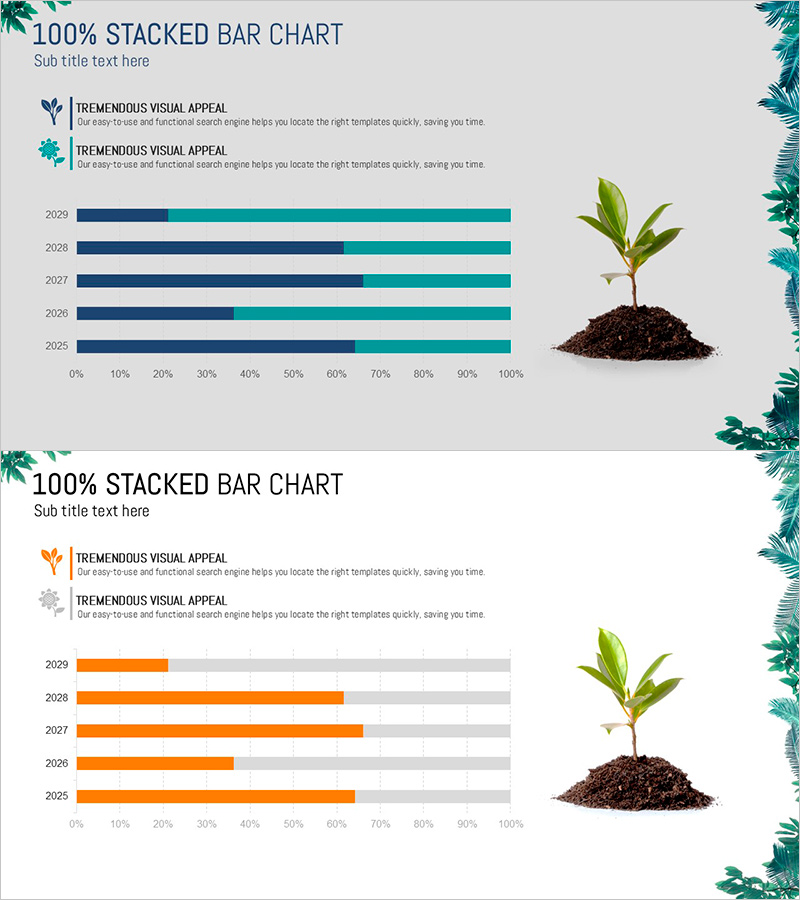
A 100% stacked horizontal bar chart PowerPoint slide designed to compare data across two series over five years. This 2-slide template features the first slide in navy and turquoise color scheme, and the second in orange and gray. Each slide displays data from 2025 to 2029 on a 0–100% scale with legend and descriptive text areas. Perfect for market analysis, performance comparison, and composition ratio presentations. Fully editable and ready to use in business reports, financial reviews, and strategic planning presentations.
Usage Points
-
Main Usage
Visualizes the proportion of two data series relative to a whole across multiple years or categories. Ideal for illustrating market share, sales composition, resource allocation, and performance metrics where ratio emphasis is critical.
-
How to Use
Edit the legend text and year labels to match your data. Adjust bar lengths to reflect actual proportions. Customize series colors for emphasis, add data labels for clarity, and modify text descriptions to fit your presentation context.
-
Recommended For
Executive reports, business performance presentations, marketing analysis, financial reviews, market research findings, and organizational performance meetings. Recommended for executives, analysts, marketers, financial professionals, and data-driven decision makers.
-
Slide Structure
2-slide set. Slide 1: Navy and turquoise 2-series stacked bars (5 bars for 2025–2029), 0–100% horizontal axis, 2-item legend, descriptive text area. Slide 2: Orange and gray 2-series stacked bars with identical layout. 16:9 widescreen format, PPTX file.
Related Products
-

Analyzing Flower Horizontal Segmentation Charts – Understanding Market Trends
#Market and Competitor Analysis #Graph #Industry Trends
-

Visualizing Camping Business Market Share with Bar Chart
#Market and Competitor Analysis #Graph #Industry Trends
-

Work and Home Life Graph – Market Trends and Design Sensibility
#Market and Competitor Analysis #Graph #Industry Trends
-

World Travel Template Horizontal Bar Segment Chart
#Market and Competitor Analysis #Graph #Industry Trends
