Stacked Bar Graph for Growing Market Trends – Business Strategy
RJ0600109_8
- Last Update 07/20/2025
- File Size 0.2MB
- # of Slides 2
- File Format PPTX
- Slide Ratio 16:9
- Color
Keywords
- #Content-Based Slides
- #Design-Based Slides
- #Business Strategy
- #Market and Competitor Analysis
- #Graph
- #Achievements
- #Industry Trends
- #Horizontal Bar
- #Segmented Horizontal Bar
- #16:9
- #stacked horizontal bar chart PowerPoint
- #time series data visualization slide
- #4-year comparison graph
- #market trend chart PPT
- #data comparison bar graph template
About the Product
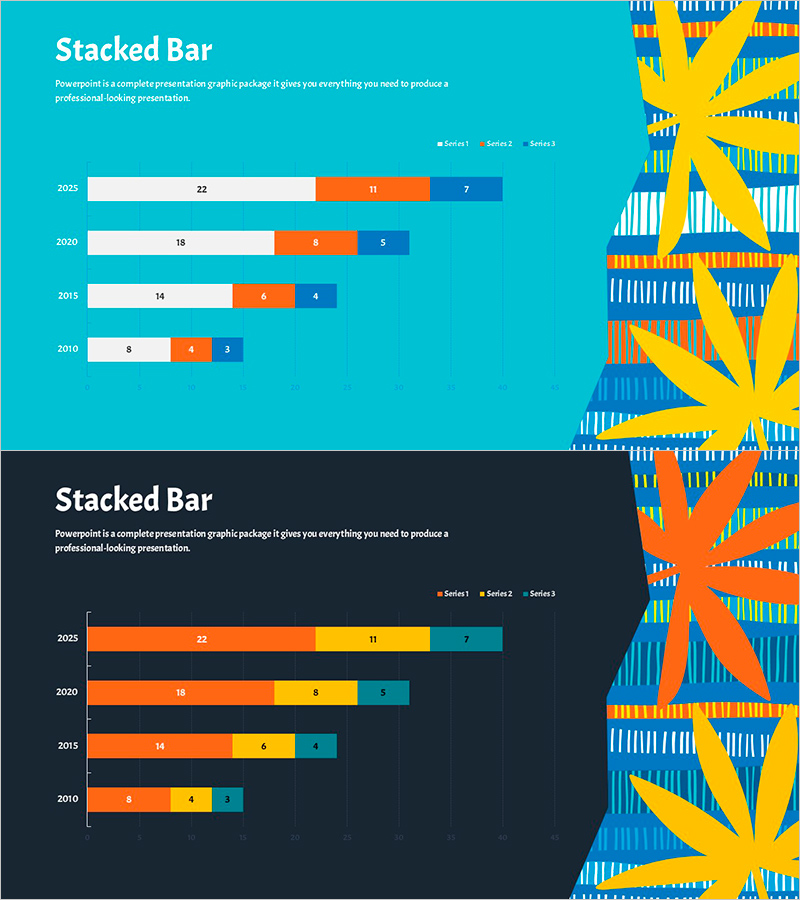
A stacked horizontal bar chart PowerPoint slide that visualizes market trends across four years with three distinct data series. Spanning 2010 to 2025, this presentation slide uses a bright turquoise background with white, orange, and navy blue bars to clearly represent data structure. Each year's values are labeled directly on the bars for easy reference during presentations. Ideal for business performance reports, market size analysis, revenue composition breakdowns, and strategic planning discussions. Provided in 16:9 PPTX format with fully editable colors, values, and layout to match your corporate branding.
Usage Points
-
Main Usage
Visualize year-over-year market trends, business performance, and revenue composition by comparing three data series across four years. The stacked format allows viewers to see both total volume and individual series contribution simultaneously, making it ideal for strategic planning and performance reporting.
-
How to Use
Insert this slide into business reports, strategy presentations, or market analysis decks in the 'Performance & Trends' section. Replace the sample values with your actual data, adjust colors to match your corporate identity, and use it to explain year-over-year changes and series-by-series breakdown during presentations.
-
Recommended For
Executives, business managers, marketing teams, and financial analysts presenting quarterly or annual performance reports, market size evolution, and revenue composition analysis. Particularly effective for strategy meetings, investor presentations, and internal performance reviews requiring multi-series temporal comparison.
-
Slide Structure
Two-slide set. First slide features bright turquoise background with 4 years (2010, 2015, 2020, 2025) × 3 series (white, orange, navy) stacked horizontal bars with value labels. Second slide provides dark gray background version for alternative theme. Legend displayed on right side, numeric labels on each bar segment.
Related Products
-

100% Stacked Column Chart Slide – Performance and Market Trends
#Business Strategy #Market and Competitor Analysis #Graph
-

Comparison Graph of Business Trends by Year – Performance and Market Trends
#Business Strategy #Market and Competitor Analysis #Graph
-

Horizontal Bar Chart for Annual Coffee Consumption – Business Strategy
#Business Strategy #Market and Competitor Analysis #Graph
-

Graph of Change in Number of Occurrences – Market Trends and Performance
#Business Strategy #Market and Competitor Analysis #Graph
