Analyzing Flower Horizontal Segmentation Charts – Understanding Market Trends
RJ0600108_9
- Last Update 07/20/2025
- File Size 0.9MB
- # of Slides 2
- File Format PPTX
- Slide Ratio 16:9
- Color
Keywords
About the Product
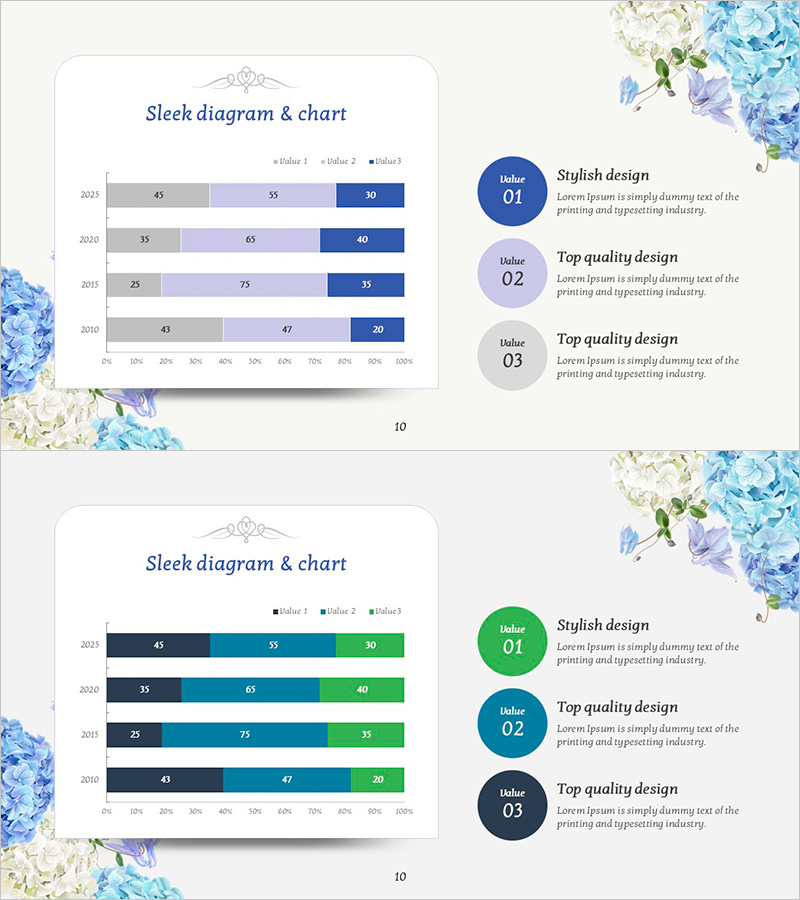
A horizontal segmented bar chart PowerPoint slide designed to compare and analyze market data across three data series. This presentation template visualizes four years of data (2021, 2020, 2015, 2010) using three distinct color tones—gray, lavender, and navy blue—with a 0% to 100% scale axis for ratio-based representation. Ideal for flower market analysis, sales performance reports, market share comparisons, and any business presentation requiring multi-series data visualization.
Usage Points
-
Main Usage
Enables comparison of numerical data across multiple years and categories by dividing each bar into three segments, allowing viewers to instantly grasp both individual values and their proportion to the whole. Commonly used for market share analysis, revenue composition, departmental performance comparison, and multi-dimensional business metrics.
-
How to Use
Input actual numerical values into the three segments of each year row; the chart automatically calculates and displays proportional ratios. The default color scheme (gray, lavender, navy) can be retained or customized to match corporate branding. Modify legend labels and axis titles to adapt the slide to different presentation contexts and data types.
-
Recommended For
Marketing reports, business analysis presentations, quarterly and annual performance reviews, executive briefings, consulting proposals, and strategic planning documents. Particularly valuable for marketing professionals, business analysts, sales managers, executives, and consultants who need to communicate complex multi-series data clearly.
-
Slide Structure
Two-slide layout. Slide 1: Title area with a horizontal segmented bar chart displaying four years of data. Slide 2: Same chart paired with three circular value badges (Value 01, 02, 03) and accompanying text descriptions for key insights. 16:9 widescreen format, PPTX file type.
Related Products
-

Bar Chart for Eco-friendly Practices Trends Visualization
#Market and Competitor Analysis #Graph #Industry Trends
-

Eco-friendly Business Market Share Segmentation Horizontal Bar Chart
#Market and Competitor Analysis #Graph #Industry Trends
-

Visualizing Camping Business Market Share with Bar Chart
#Market and Competitor Analysis #Graph #Industry Trends
-

Yellow Green Detailed Analysis Chart - Visualizing Market Trends
#Business Strategy #Market and Competitor Analysis #Diagram
