100% Stacked Bar Chart Abstract Pattern Presentation
RJ0200033_6
- Last Update 04/07/2025
- File Size 0.8MB
- # of Slides 2
- File Format PPTX
- Slide Ratio 16:9
- Color
Keywords
- #Content-Based Slides
- #Design-Based Slides
- #Market and Competitor Analysis
- #Graph
- #Other
- #Market Analysis
- #Industry Trends
- #Horizontal Bar
- #Segmented Horizontal Bar
- #Map
- #16:9
- #stacked bar chart PowerPoint
- #100% stacked bar graph template
- #year-over-year comparison slide
- #market analysis chart
- #horizontal bar chart presentation
About the Product
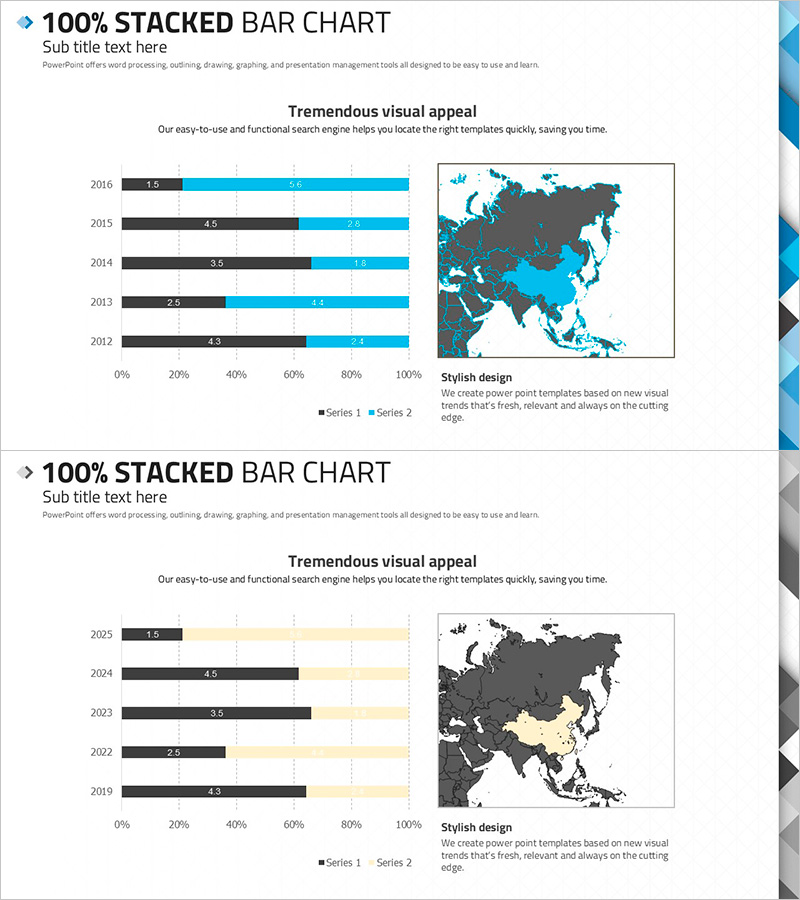
A 100% stacked bar chart PowerPoint slide optimized for year-over-year data comparison and market share analysis. The slide features two data series in black and blue, clearly visualizing the proportion changes across five years from 2012 to 2016. Horizontal bars display the percentage composition of each series, with a world map positioned on the right side to provide global market context. This presentation slide is ready to use for business reports, investor decks, and competitive analysis presentations where market share, revenue composition, or customer segmentation needs to be explained.
Usage Points
-
Main Usage
Displays the proportion and composition changes of data across years or categories simultaneously. The 100% stacked format allows clear comparison of relative percentages between series, making it ideal for business analysis materials such as market share trends, revenue composition, and customer segmentation.
-
How to Use
Use slide 1 with blue accent for technology presentations or growth-focused data emphasis. Use slide 2 with beige tones for conservative reports or financial analysis presentations. Reference the world map when explaining global market size or regional market share distribution.
-
Recommended For
Executive reports, investor presentations, marketing strategy pitches, business analysis reports, and competitive benchmarking documents. Particularly useful for finance teams, marketing departments, and business planning teams explaining market analysis, sales performance, and customer composition ratios.
-
Slide Structure
Each slide contains a title area, 100% stacked bar chart (5 years × 2 data series), legend, and world map image. Bars display the percentage composition of two series within the 0–100% range, with numerical labels on each bar segment for precise value reference.
Related Products
-

Stacked Bar Chart by Country – Visualizing Market Trends
#Market and Competitor Analysis #Graph #Other
-

Paint Piano and Segmentation Bar Graph – Market Trend Analysis
#Market and Competitor Analysis #Graph #Market Analysis
-

National Trend Change Graph Visualization – Horizontal Bar Chart
#Market and Competitor Analysis #Graph #Other
-

Target Market Analysis Data Table - Market Growth Statistics
#Market and Competitor Analysis #Graph #Other
