Botanic Garden Management Bundled Graph – Market and Performance Analysis
RJ0600083_26
- Last Update 07/12/2025
- File Size 0.5MB
- # of Slides 2
- File Format PPTX
- Slide Ratio 16:9
- Color
Keywords
- #Content-Based Slides
- #Design-Based Slides
- #Market and Competitor Analysis
- #Financial Plans and Performance
- #Graph
- #Competitor Analysis
- #Sales and Revenue
- #Column
- #Grouped Column
- #16:9
- #grouped column chart PowerPoint
- #dual-series bar chart template
- #comparison analysis slide
- #market analysis PowerPoint template
- #graph slide design download
About the Product
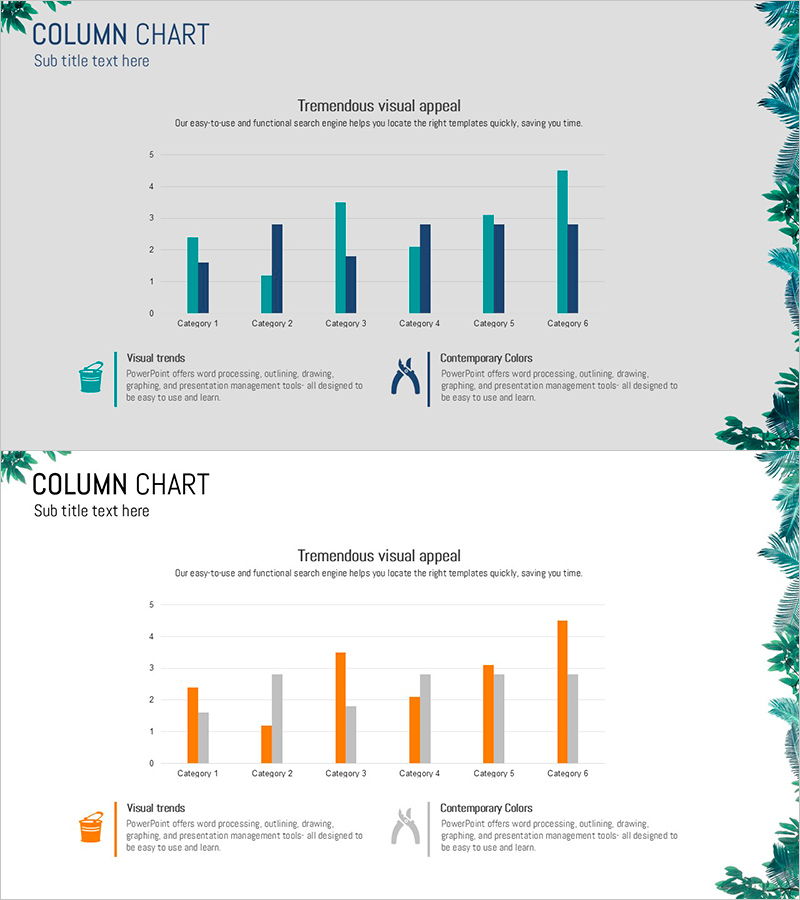
A 2-slide PowerPoint presentation optimized for botanical garden management and market analysis. This grouped column chart template displays 6 categories with 2 data series (teal & navy blue, or orange & gray) positioned side-by-side for intuitive numerical comparison. Left-side legend includes visual trends icon; right side features contemporary color description. Instantly applicable to market performance, competitive analysis, and financial metrics. Delivered in 16:9 widescreen PPTX format compatible with all presentation environments.
Usage Points
-
Main Usage
Compare two data series across categories in analytical presentations. Ideal for market size vs. actual performance, competitive benchmarking, quarterly revenue trends, departmental KPI achievement rates, and data-driven decision-making materials.
-
How to Use
Edit column heights to input actual data values. Modify legend text and category labels as needed. Adjust series colors to match your brand guidelines. Update title and subtitle for your specific presentation context—executive reports, investor pitches, or internal team meetings.
-
Recommended For
Botanical garden and tourism facility managers, marketing and sales teams presenting performance metrics, finance and planning departments reporting budget vs. actual results, consulting firms presenting market research findings, and SME executives reviewing quarterly performance reviews.
-
Slide Structure
Slide 1: Grouped column chart with 6 categories in teal & navy blue series + legend (visual trends icon, contemporary colors). Slide 2: Same structure with orange & gray series. Title and subtitle area at top; descriptive text area at bottom of each slide.
Related Products
-

Simple Design Trend Wide PPT Vertical Bar Chart
#Market and Competitor Analysis #Financial Plans and Performance #Graph
-

Sensuous Cloud Presentation Template – Market Analysis and Financial Performance
#Market and Competitor Analysis #Financial Plans and Performance #Graph
-

Volume Presentation Template with Tables and Clustered Charts – Efficient Data Analysis
#Market and Competitor Analysis #Financial Plans and Performance #Diagram
-

Triangle Pattern Column Chart Presentation Template
#Market and Competitor Analysis #Financial Plans and Performance #Diagram
