Volume Presentation Template with Tables and Clustered Charts – Efficient Data Analysis
RJ0200017_13
- Last Update 04/02/2025
- File Size 3MB
- # of Slides 2
- File Format PPTX
- Slide Ratio 16:9
- Color
Keywords
- #Content-Based Slides
- #Design-Based Slides
- #Market and Competitor Analysis
- #Financial Plans and Performance
- #Diagram
- #Graph
- #Competitor Analysis
- #Sales and Revenue
- #Table
- #Column
- #Horizontal Table
- #Grouped Column
- #16:9
- #clustered bar chart PowerPoint
- #data comparison presentation slide
- #table chart template
- #4-item graph design
- #financial analysis slides
- #PowerPoint chart template
About the Product
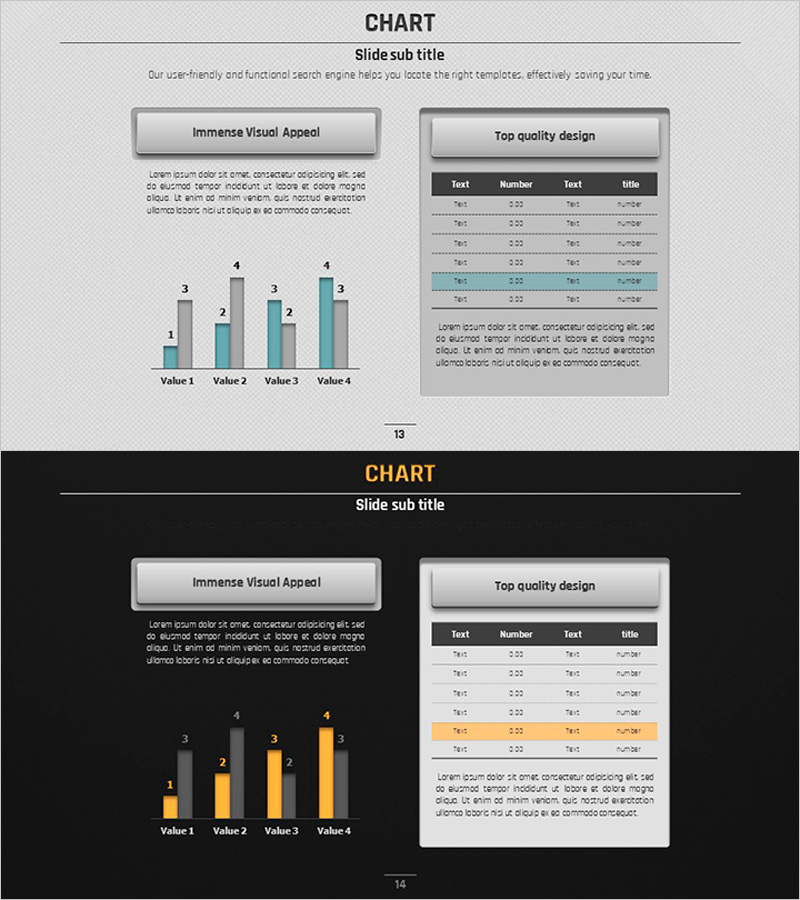
A PowerPoint slide featuring a clustered bar chart comparing numerical data across four items with a complementary data table. The chart uses gray and teal color series to enable clear comparative analysis of each item. The right side includes a structured data table with Text, Number, Text, and Title columns for organizing quantitative information. This presentation slide is ready to use for market analysis, financial planning, performance comparisons, and other data-driven presentations. Two versions are provided—light background and dark background—allowing you to select the version that best suits your presentation environment.
Usage Points
-
Main Usage
Visually compare and analyze numerical data across multiple categories in a presentation. The clustered bar chart displays two or more data series side-by-side for each item, making it ideal for comparative analysis. The accompanying table on the right provides precise numerical values, combining visual impact with data credibility.
-
How to Use
Use this slide for marketing performance reports, quarterly revenue comparisons, competitive benchmarking, budget allocation reviews, and other quantitative analyses. Edit the chart values and colors to input your own data, and add or remove table rows to adjust the number of items. Choose between the light-background or dark-background version based on your presentation venue's lighting and projector setup.
-
Recommended For
Recommended for finance teams, marketing departments, executive reporting, quarterly earnings presentations, investor briefings, consulting proposals, and business performance analysis. Particularly effective when comparing two or more metrics simultaneously (e.g., year-over-year, Product A vs. Product B, target vs. actual).
-
Slide Structure
The left side displays a clustered bar chart with four items (Value 1–4), each showing two data series in gray and teal bars. The right side contains a data table with four columns (Text, Number, Text, Title) and six rows. Two versions are provided: one with a light gray background and one with a black background for flexible presentation options.
Related Products
-

Simple Design Trend Wide PPT Vertical Bar Chart
#Market and Competitor Analysis #Financial Plans and Performance #Graph
-

Botanic Garden Management Bundled Graph – Market and Performance Analysis
#Market and Competitor Analysis #Financial Plans and Performance #Graph
-

Sensuous Cloud Presentation Template – Market Analysis and Financial Performance
#Market and Competitor Analysis #Financial Plans and Performance #Graph
-

Triangle Pattern Column Chart Presentation Template
#Market and Competitor Analysis #Financial Plans and Performance #Diagram
