Sensuous Cloud Presentation Template – Market Analysis and Financial Performance
RJ0200040_17
- Last Update 04/09/2025
- File Size 3.6MB
- # of Slides 2
- File Format PPTX
- Slide Ratio 16:9
- Color
Keywords
- #Content-Based Slides
- #Design-Based Slides
- #Market and Competitor Analysis
- #Financial Plans and Performance
- #Graph
- #Competitor Analysis
- #Sales and Revenue
- #Column
- #Grouped Column
- #16:9
- #grouped column chart PowerPoint
- #bar chart slide template
- #data comparison graph
- #annual performance analysis
- #financial data visualization
About the Product
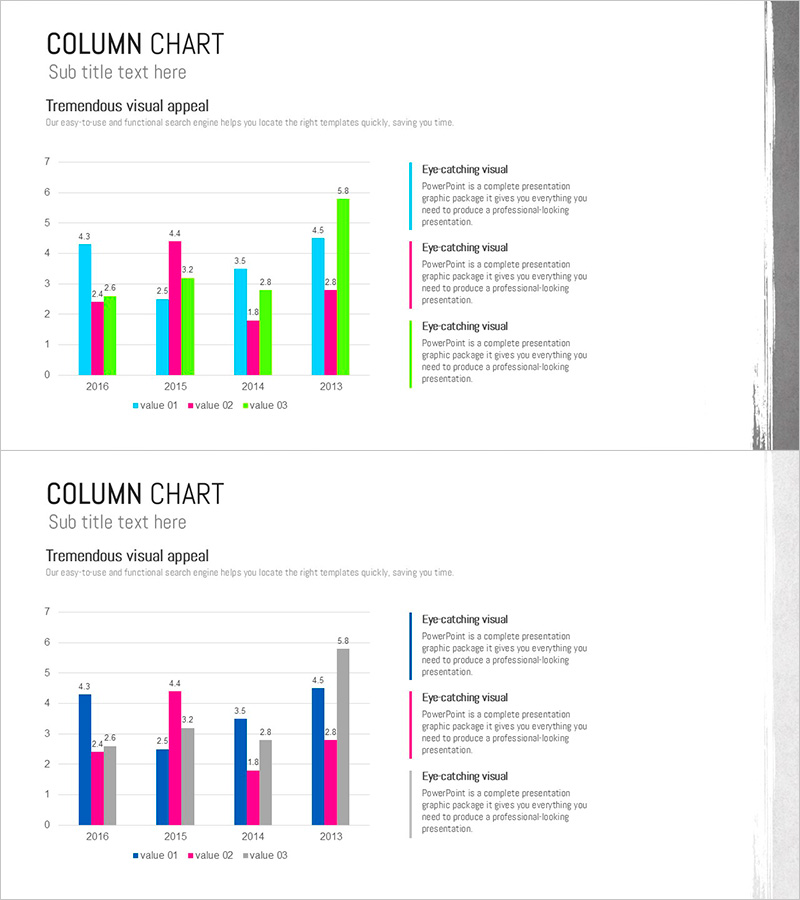
A grouped column chart PowerPoint slide template for comparing 4 data series across 4 years (2016–2013). This presentation slide uses cyan, magenta, and lime green colors to distinguish each series, making it ideal for market analysis and financial performance visualization. The right side features a legend and text annotation area for highlighting key insights. Perfect for business reports, financial presentations, and competitive analysis where multi-series data comparison is essential.
Usage Points
-
Main Usage
Enables side-by-side comparison of multiple data series across time periods or categories. Commonly used for market analysis, financial reporting, competitive benchmarking, sales performance tracking, and quarterly/annual results presentations where quantitative data-driven insights are critical.
-
How to Use
Input your 4-series numerical data for each year, and the chart updates automatically. Add key findings or interpretations in the legend and text annotation area on the right to enhance audience comprehension. Colors and values are fully editable to match your brand or data emphasis.
-
Recommended For
Finance teams, marketing departments, sales divisions, and executive presentations. Ideal for quarterly/annual performance reviews, market share analysis, competitive positioning, budget vs. actual reporting, and KPI dashboards.
-
Slide Structure
2-slide deck. First slide features a grouped column chart with 4 series (value 01–03) across 4 years, with legend and 3 text callout boxes on the right. Second slide provides an alternative design variation. 16:9 widescreen format, PPTX file.
Related Products
-

Botanic Garden Management Bundled Graph – Market and Performance Analysis
#Market and Competitor Analysis #Financial Plans and Performance #Graph
-

Triangle Pattern Column Chart Presentation Template
#Market and Competitor Analysis #Financial Plans and Performance #Diagram
-

Simple Design Trend Wide PPT Vertical Bar Chart
#Market and Competitor Analysis #Financial Plans and Performance #Graph
-

Volume Presentation Template with Tables and Clustered Charts – Efficient Data Analysis
#Market and Competitor Analysis #Financial Plans and Performance #Diagram
