Simple Design Trend Wide PPT Vertical Bar Chart
RJ0200059_29
- Last Update 04/15/2025
- File Size 0.2MB
- # of Slides 2
- File Format PPTX
- Slide Ratio 16:9
- Color
Keywords
- #Content-Based Slides
- #Design-Based Slides
- #Market and Competitor Analysis
- #Financial Plans and Performance
- #Graph
- #Competitor Analysis
- #Sales and Revenue
- #Column
- #Grouped Column
- #16:9
- #vertical bar chart PowerPoint
- #clustered chart template
- #data comparison slide
- #graph PowerPoint slide
- #financial analysis chart
About the Product
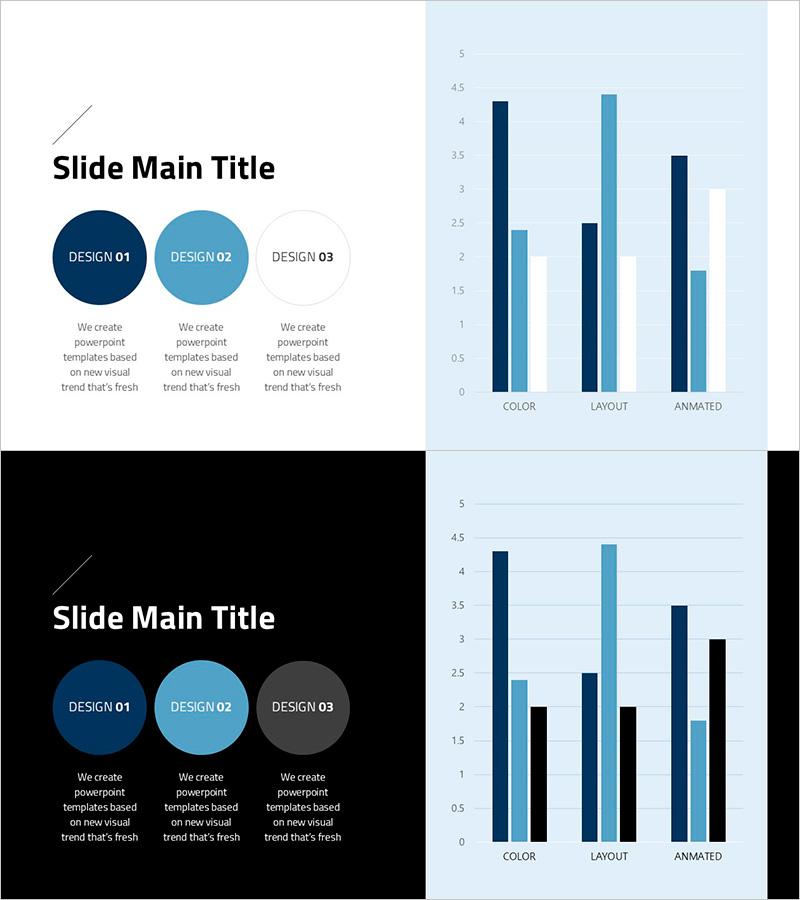
A professional vertical bar chart PowerPoint slide set optimized for marketing and financial analysis presentations. This 2-slide deck features clustered bar graphs in dark blue, light blue, and white color schemes, enabling simultaneous comparison of up to 4 data series across 3 categories (COLOR, LAYOUT, ANIMATED). Delivered in 16:9 widescreen PPTX format with fully editable elements, perfect for market analysis, sales performance, budget planning, and comparative reporting.
Usage Points
-
Main Usage
Designed for marketing, finance, and sales teams to compare multiple data points simultaneously. Visualizes quarterly revenue, departmental performance, competitive benchmarking, and budget-vs-actual scenarios with 3-4 data series in clear, professional format.
-
How to Use
Two slides offer different background colors (light blue and white) and presentation modes (static and animated). Select the appropriate background for your presentation context, input your data values, and bar heights adjust automatically. Colors, fonts, and legends are fully customizable to match corporate branding.
-
Recommended For
Finance teams, marketing departments, sales executives, and business analysts preparing quarterly reports, budget reviews, market analysis, and performance evaluations. Ideal for stakeholder presentations requiring quantitative evidence and multi-series data visualization.
-
Slide Structure
2-slide set organized into 3 sections (COLOR, LAYOUT, ANIMATED) per slide. Each section contains a clustered vertical bar graph supporting up to 4 data series. Legend, axis labels, and data entry fields are clearly delineated for easy customization.
Related Products
-

Volume Presentation Template with Tables and Clustered Charts – Efficient Data Analysis
#Market and Competitor Analysis #Financial Plans and Performance #Diagram
-

Sensuous Cloud Presentation Template – Market Analysis and Financial Performance
#Market and Competitor Analysis #Financial Plans and Performance #Graph
-

Triangle Pattern Column Chart Presentation Template
#Market and Competitor Analysis #Financial Plans and Performance #Diagram
-

Botanic Garden Management Bundled Graph – Market and Performance Analysis
#Market and Competitor Analysis #Financial Plans and Performance #Graph
