Horizontal Bar Chart for Market Trends Analysis – Enhance Competitive Advantage
RJ0600083_16
- Last Update 07/12/2025
- File Size 0.5MB
- # of Slides 2
- File Format PPTX
- Slide Ratio 16:9
- Color
Keywords
- #Content-Based Slides
- #Design-Based Slides
- #Market and Competitor Analysis
- #Graph
- #Industry Trends
- #Competitive Advantage
- #Horizontal Bar
- #16:9
- #horizontal bar chart PowerPoint slide
- #bar chart comparison design
- #market trend analysis slide
- #competitive analysis PPT
- #how to create a comparison chart in PowerPoint
About the Product
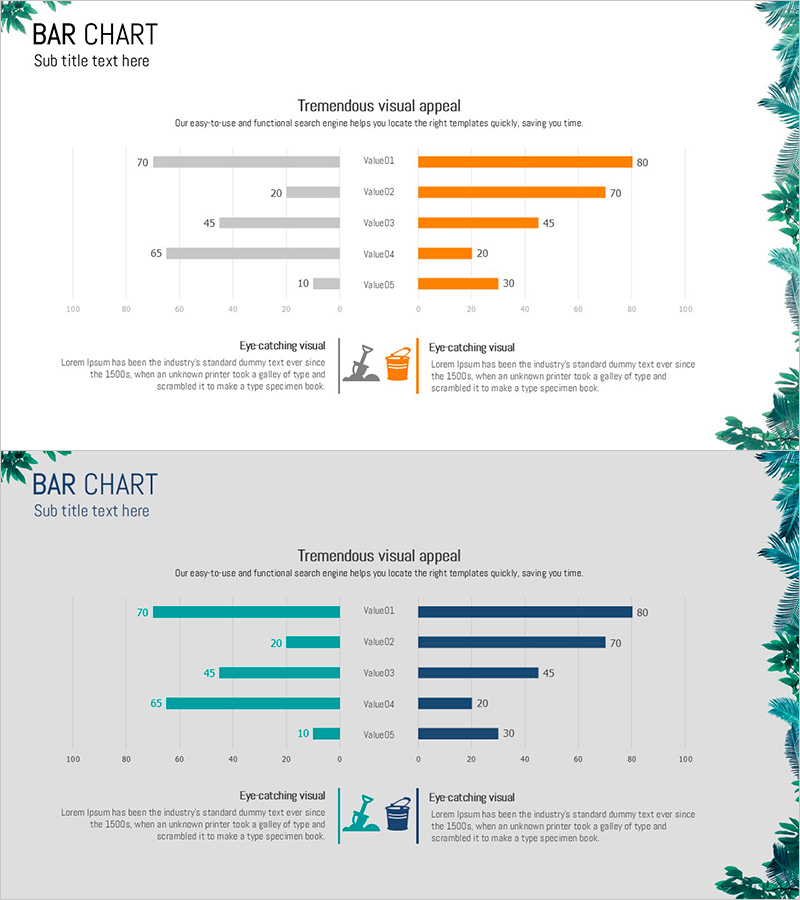
A horizontal bar chart PowerPoint slide designed to compare market trends and competitive advantages at a glance. The dual-layout design features gray bars on the left and orange bars on the right, displaying five data points simultaneously for easy comparison. Numeric labels are clearly positioned above each bar for immediate reference during presentations. The slide includes a title and subtitle area at the top, with two icon-based text boxes in the center to support data interpretation. Available in 16:9 widescreen PPTX format, fully editable across all presentation software. Customize colors and values instantly to adapt the slide for various analytical reports and business presentations.
Usage Points
-
Main Usage
Optimized for visualizing two comparable metrics simultaneously—market analysis, competitor benchmarking, and performance indicator comparisons. The left-right contrast layout clearly presents decision-making evidence, strengthening data credibility in investor and executive presentations.
-
How to Use
Enter your analysis topic in the title and subtitle fields at the top. Input baseline values (previous year, competitor, target) in the left gray bars and current values (current year, your company, actual results) in the right orange bars. Adjust bar lengths and numeric labels automatically, then summarize key insights in the two icon-labeled text boxes below.
-
Recommended For
Ideal for business reports, investor presentations (IR), marketing strategy documents, and executive briefings. Commonly used by finance, marketing, and management teams for quarterly and annual performance comparisons and market analysis sections.
-
Slide Structure
Two-slide set: Slide 1 features gray-orange dual horizontal bars with five data points; Slide 2 features teal-navy dual horizontal bars with five data points. Each slide includes one title/subtitle input area at top, one chart area in center, and two icon-labeled text boxes at bottom for interpretation.
Related Products
-

Touch Wide Slide Template – Segmentation Graph Usage
#Market and Competitor Analysis #Graph #Industry Trends
-

Variation Segmentation Graph for Reading Volume – Market Trend Insights
#Market and Competitor Analysis #Graph #Industry Trends
-

Geometry PPT Template Wide Horizontal Bar Segmentation Graph
#Market and Competitor Analysis #Graph #Industry Trends
-

Travel Horizontal Bar Bundled Graph – Market Trends and Competitive Advantage
#Market and Competitor Analysis #Graph #Industry Trends
